NASDAQ analysis 29/11/2025:
We are presenting the weekly chart of nasdaq. We are going to do a though experiment. We are going to imagine how the next week’s candle will form based on the information on the chart and based on the news events scheduled to be published in the next week and the important final event of the year = FOMC meeting of December in 10 days time. These news events are used by the market makers to manipulate the market and trap traders on the wrong side. Our job is to identify the higher time frame trend and to identify manipulation. By the doing this exercise week after week, we get to become better at identifying manipulation and how price is being delivered.
The higher time frame trend reveals to us the market makers intentions. So if we can identify the higher time frame trend, sudden moves in the opposite direction to the higher time frame trend which takes out liquidity would be considered as manipulation. We can then use standard deviation of the manipulation leg to identify potential targets.
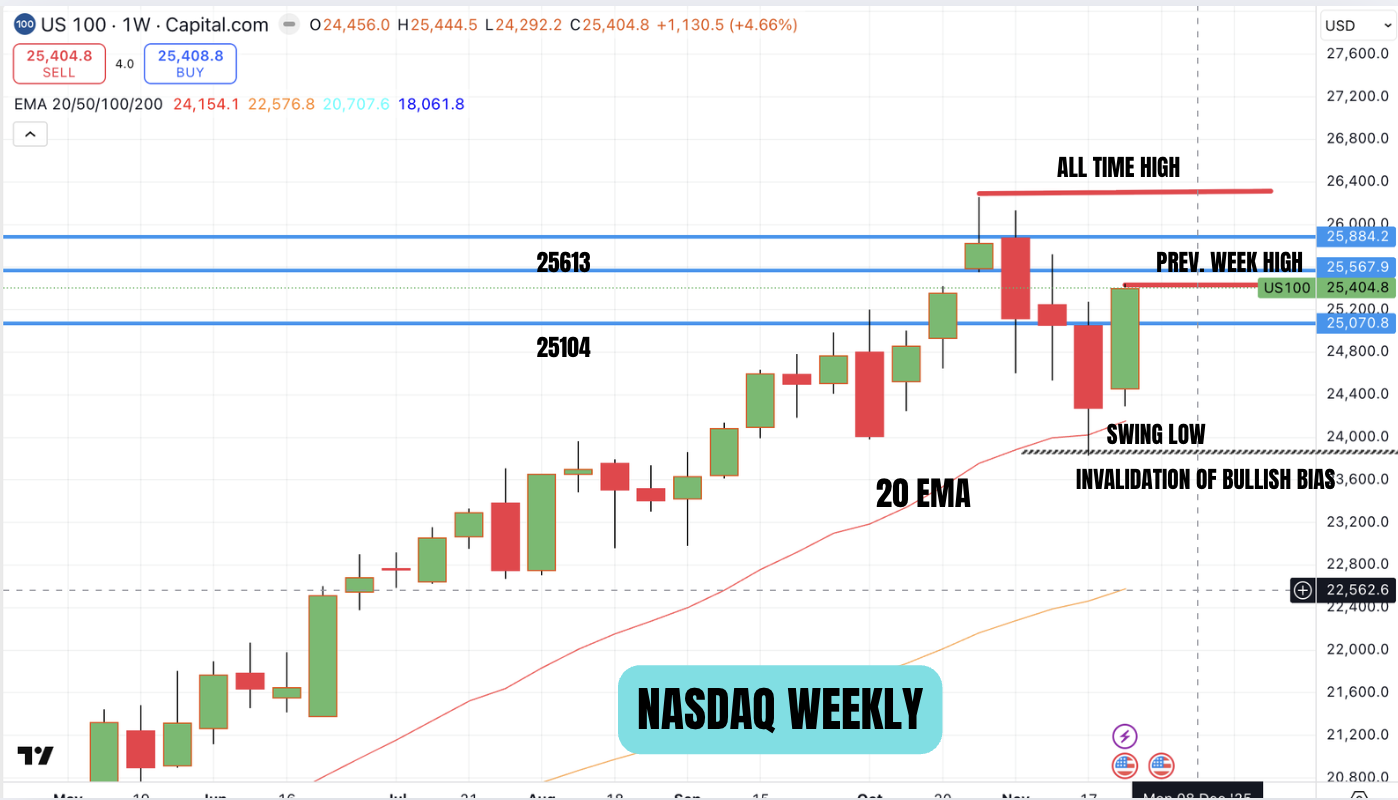
First let us look at the weekly chart of Nasdaq. We have been in a clear uptrend. The price has been above the 20 week ema for more than 6 months. This is the first time it has tested this ema in that time and in strong trends we can expect atleast a bounce. We can see from the chart that a swing low has been formed. A swing low is 3 candles in sequence where the candle with lowest low has a higher low on either side of it. Once a swing low is formed, until that swing low is broken in our view, we have a higher low formed on the weekly chart. This is illustrated in the line chart below.
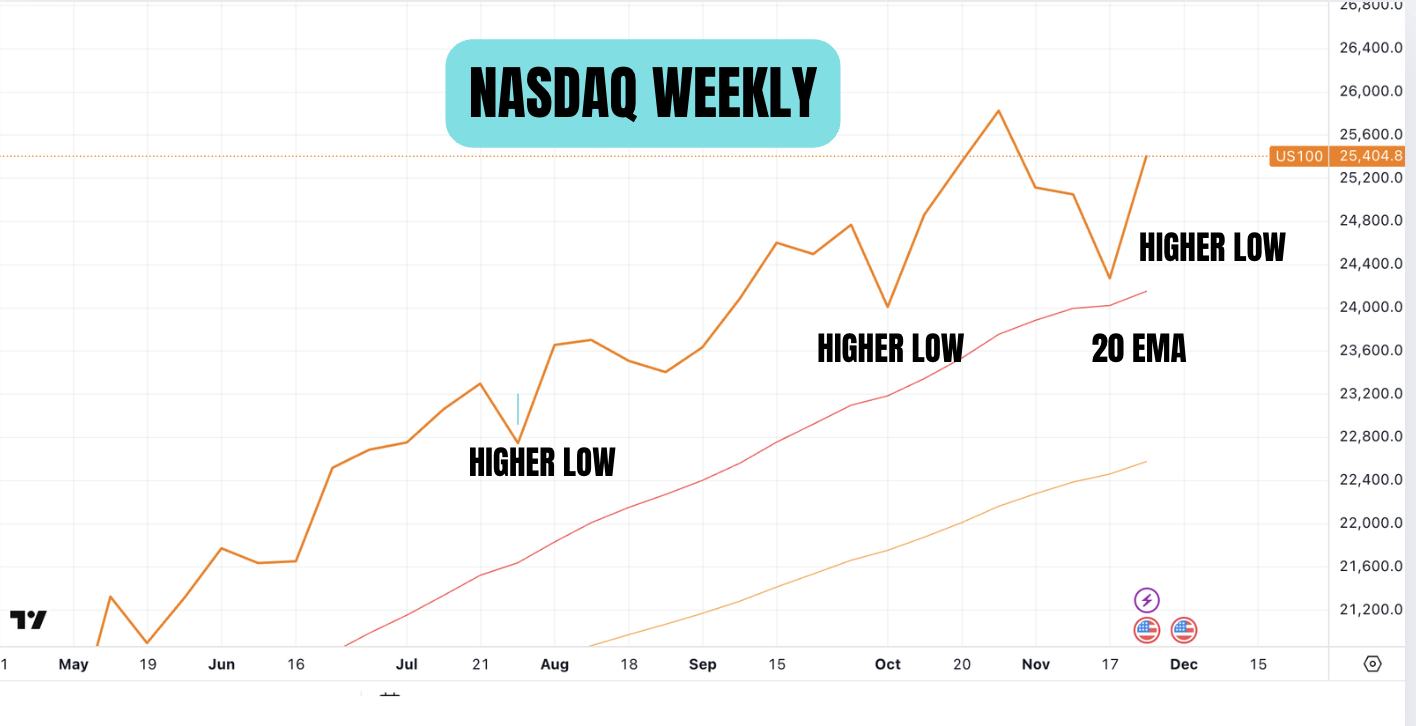
So based on the higher time frame weekly chart, we have come to the conclusion that we are still in an uptrend. The 20 week ema held and the price has made a higher low. Until this higher low is broken, we are in a uptrend. Also if you see the candle stick chart, the price of the most recent swing low goes below the previous higher low but closes above it. This is a liquidity purge rather than a change in market structure.
When we are in a uptrend, we expect the previous candle high to be broken through to the upside and when we are in a downtrend, we expect the previous candle low to be broken to the downside. This is true for all time frames.
Because we are bullish for next week, we want to see if price can take out the previous week high. Any retracement from the weekly open on Sunday into the range of the previous week candle should be used as an opportunity to buy at a discount.
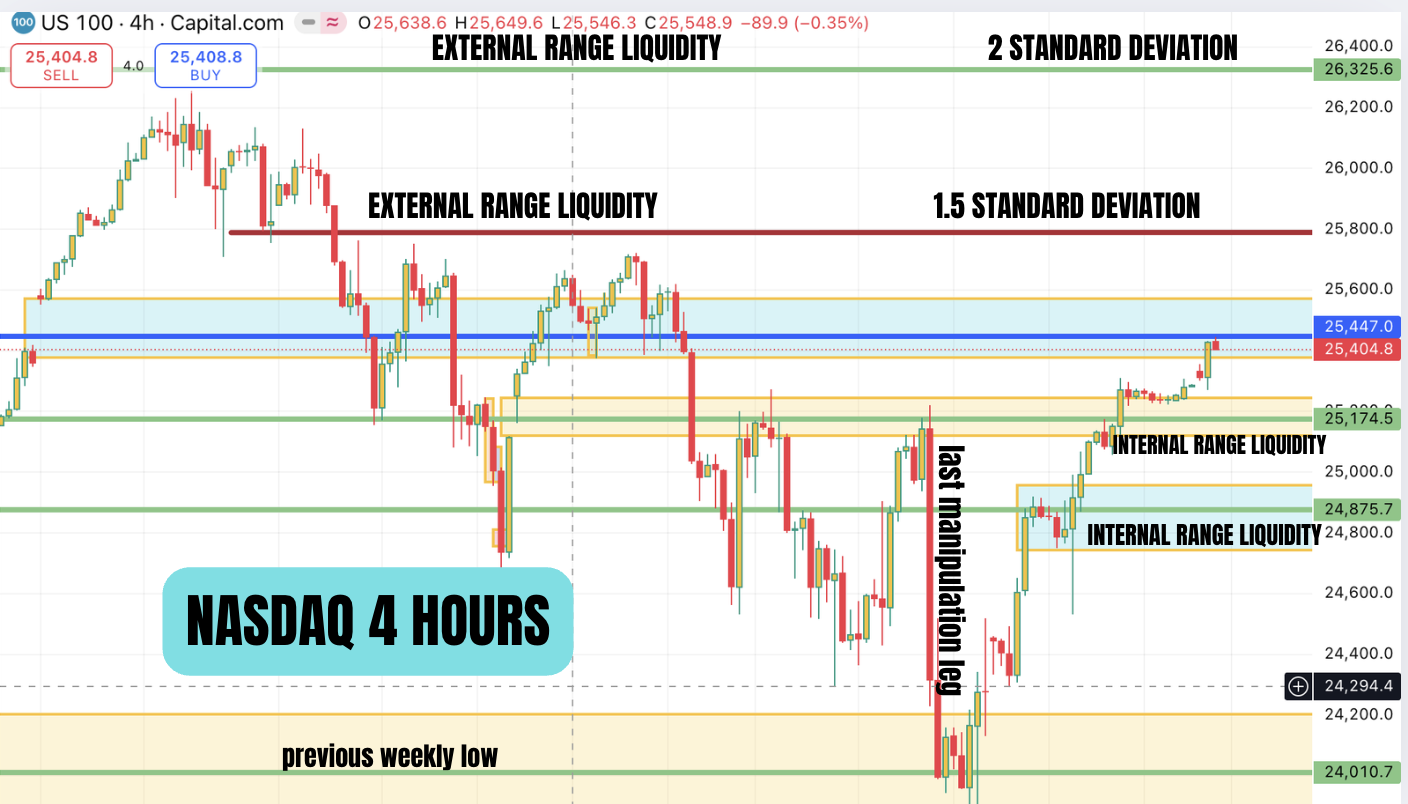
we now have the 4 hour chart of the Nasdaq. We have marked out the liquidity pools on both above and below the current price. The liquidity pool that resides above is the external range liquidity ( it is above the current price leg) and the liquidity pool that resides below the current price is internal range liquidity.
As the market makers are targetting liquidity, algorithmic concepts also wait for liquidity to be taken before entry. We are reasonably confident that the liquidity pool above current price ( external range liquidity) will be taken( >50% chance) So we are looking for long entries from internal range liquidity. Ideally Nasdaq is very bullish price will be supported at the orange zone and will never come to the lower blue zone. At Muffett investments if the price comes to internal range liquidity before external range liquidity is taken, we will look for long opportunities to target the external range liquidity. Another Algorithmic concept is Price goes from internal range liquidity to external range liquidity.
If however the price goes to the external range liquidity first without taking the internal range liquidity, we will become cautious and be on the lookout for a correction back into the internal range liquidity. So price also goes from external range liquidity to internal range liquidity.
So if we are able to identify higher time frame trend confidently (it is not always obvious like this) and we can identify the liquidity pools we can frame trades that are in line with the market makers. We can identify manipulation and we enter after liquidity is taken and target the opposity liquidity. As the higher time frame trend gives us the market makers intentions, if we only take trades in the direction of the trend, then we have entries that have much better risk reward ratio than other techniques. This is the core concept of algorithmic trading.
So for next week we are expecting previous week high to be taken and one of the internal range liquidity pools will be taken. So we expect a slightly smaller candle which wicks above the previous week high and the body closing within the range of the previous week’s range.If we do not take the previous week high or one of the internal range liquidity pools, we would consider this as an attempt to engineer liquidity which will be taken the week after either before or after FOMC.
Finally we can use standard deviation projections to give us targets. 1.5 standard deviation projection of the last manipulation leg will give a target of 25800 and this will take out the external range liquidity. 2 standard deviation projection will give us a target of 26330 and this will take out the recent highs.
Disclaimer; Analysis done in good faith and is for educational purposes only. The intention of this blog is to showcase how to analyse the chart using algorithmic concepts and is not investment advice.