Hedging the portfolio with GBPJPY: A multi-asset strategy
At Muffett investments we are big believers in asset diversification. Many portfolio managers are limited by the assets that they can trade and limits their ability to profit from other asset classes. The passive investment trends and the need to match the returns of the S&P 500 by the active managers means that they are forced to buy the Mag7 stocks and other leading stocks. This leads to concentration of money in a few stocks and when the trend reverses, everyone wants to get out and this leads to exaggerated movements in the market.
This is where the Multi-asset strategy excels. We are not limited by which assets to own and forex pairs give us a return which totally not correlated with stock market performance. The forex markets can trend for long periods of time and is much more predictable and less volatile than index hedges.
Here we will present a GBPJPY hedging strategy that is unique and we will execute the trade under right conditions which we will present here. GBPJPY is one of the currencies that is commonly used in carry trade.
A carry trade is a leveraged cross-currency position designed to take advantage of interest rate differentials and low volatility. The strategy involves borrowing funds at a low interest rate in one currency (the funding currency) and buying a higher-yielding asset in another (the target currency). In recent years, low interest rates for the Japanese yen relative to other currencies have made the yen a funding currency of choice . The use of leverage makes these positions sensitive to changes in exchange rates, interest rates and volatility. To understand this we present the following chart which shows the yield differential between the British pound and the Japanese Yen.
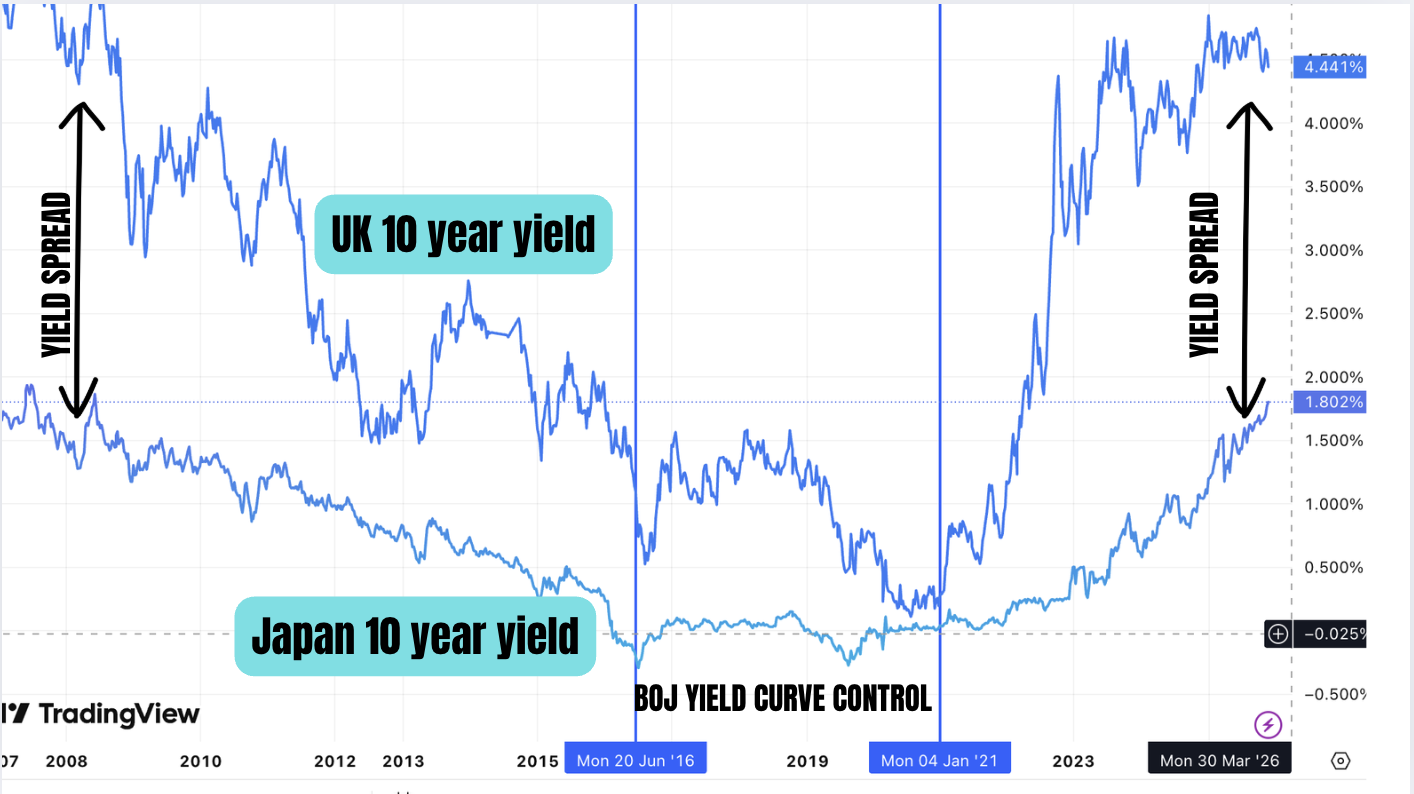
As you can see since 2021, the yield spread between the 10 year yield of UK and Japan has been rising. This is due to increasing inflation expectations and QT done by the Bank of England. The Bank of Japan, was using yield curve control between 2016 to 2020 to keep the 10 year yield at near 0%. However due to inflation concerns and the risks posed by the rising carry trade they have allowed the yields to rise. The spread is still wide enough for the carry trade to be implemented especially if this is combined with investing in asset in the higher yielding currency. The most common form of this is the USDJPY carry trade. Most of these are being used by hedge funds based in Cayman islands and UK to borrow yen at cheap rates and buy US stocks. Because of the wide yield differential GBPJPY carry trade also happens to a lesser extent.
According the the Bank of International settlements, it is notoriously difficult to estimate the extent of the carry trade. The IBS (BIS statistics) show a sustained rise in on-balance sheet yen borrowing over the past few years, an increase that may be linked to carry trades. Banks' yen-denominated claims – which include loans, holdings of debt securities and derivatives with a positive market value – on non-banks resident outside of Japan reached $880 billion, or ¥133 trillion, in Q1 2024 (up from ¥110 trillion in Q4 2021). The bulk of these claims are on borrowers in the Cayman Islands, mainly non-bank financial institutions (NBFIs).
The carry trade can only happen if the yield differentials are stable and there is not much volatility between the two currencies. As the trades are leveraged slight movement of the currencies in the opposite direction will incur huge losses rendering the carry trade unprofitable. When asset prices are rising and the funding currency is depreciating (JPY has had a 50% fall over the last 3 years) the trades can be extremely profitable. So in a way we can say that GBPJPY is a risk on indicator.. When the asset prices fall, the carry trades are quickly unwinded and will lead to strengthening of the yen. we saw this during the 2008 financial crisis.

The monthly chart of GBPJPY shows that price is near an important liquidity level. This zone is from 216- 220. The price is currently trading near a recent high which has been designed to engineer liquidity in advance of the move into the liquidity zone. We think that this zone is very important. In fact once the 208.20 level is broken, we will be looking for confirmation to enter short on GBPJPY. On the left hand side, we can see the effects of the unwind of the carry trade during the 2008 financial crisis. We believe that a GBPJPY hedge that is enacted at the right level will give an asymmetric protection to the portfolio.
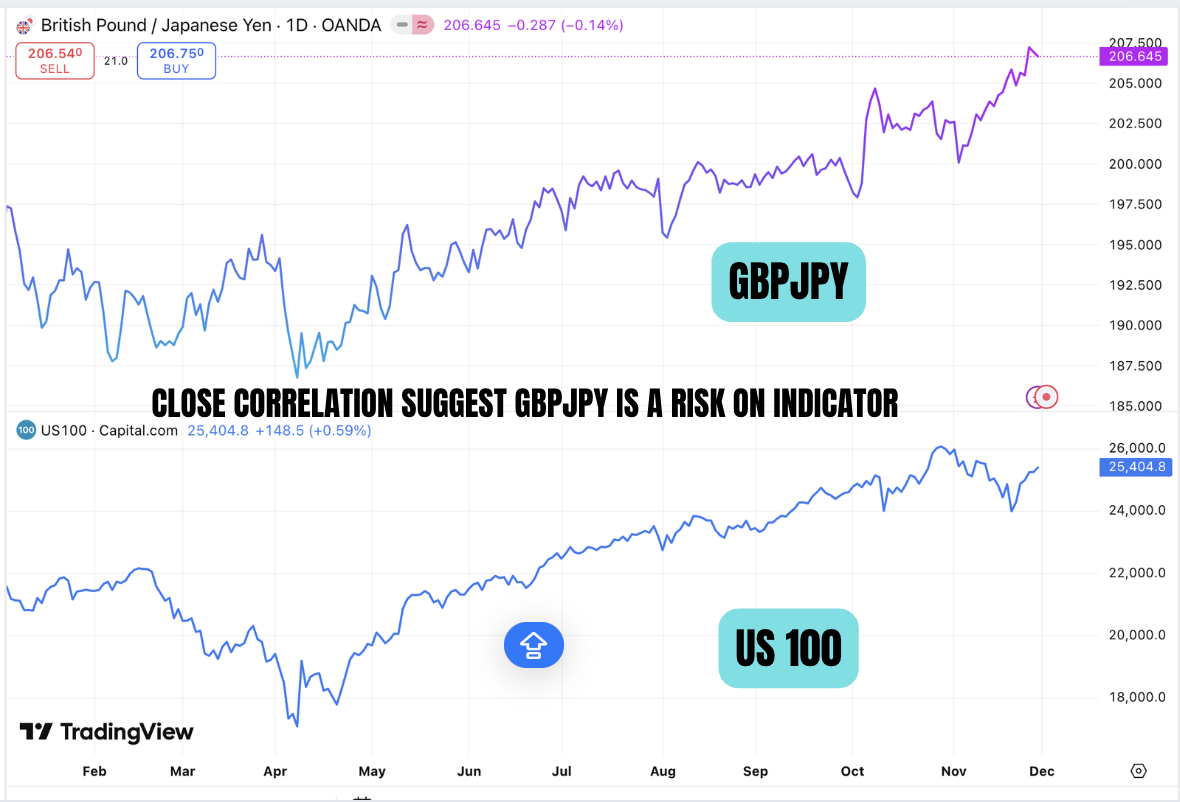
Why GBPJPY and why not USDJPY. We believe that there is a very close correlation between GBPJPY and other risk assets especially US equities. The above figure clearly shows the close correlation. GBP is also a risk on currency and sometimes weakness in GBP on its own will precede falls in Nasdaq.

This is the GBPJPY weekly chart divided into quarters. You can see the liquidity purge Q2 before moving higher. We think that once we take the near term high and price goes into the liquidity zone, it will get rejected and price has a good chance of a move back to 198 and 194 level. This trade will take a few weeks to evolve and we think the shorts can be taken around beginning of next year depending on the price action. The most likely scenario would be a high formed this quarter which will raided in the next quarter followed by a fall. If we do have a correction in the indices, then we can have bigger falls in GBPJPY from carry trade unwind.
Now it is important to realise that hedges are to protect the portfolio and some times inorder to protect the portfolio, we may have to take losses on the hedges. There is no free lunch. So we design it in a way that gives asymmetric protection and at the same time we can define the risk and take a loss if the market continues to go higher.
Disclaimer: Forex trading and hedging are highly complex and is not suitable for average investor who should seek financial advice. Analysis done in good faith and is for educational purposes only.