Trading against retail: GBPUSD trade example- 26/11/2025
This is a reflection on the trade we took on 25/11/2025 and 26/11/2026. For context, 26/11/2025 was the budget day where the UK chancellor would deliver widely expected tax raises on a sluggish economy. At Muffett investments, we have been bearish on the pound for a long time. Also based on our weekly analysis on DXY, we were bullish on DXY but we were more focussed on USDJPY.
The reason that got us interested is that, we saw a post on Linkedin where on of the popular guys had posted that he is bearish on the pound and he has evidence that multiple parties have shorted the Pound through the forex options market. Also the budget was widely perceived by the community as bearish for the British economy and bearish for the pound.
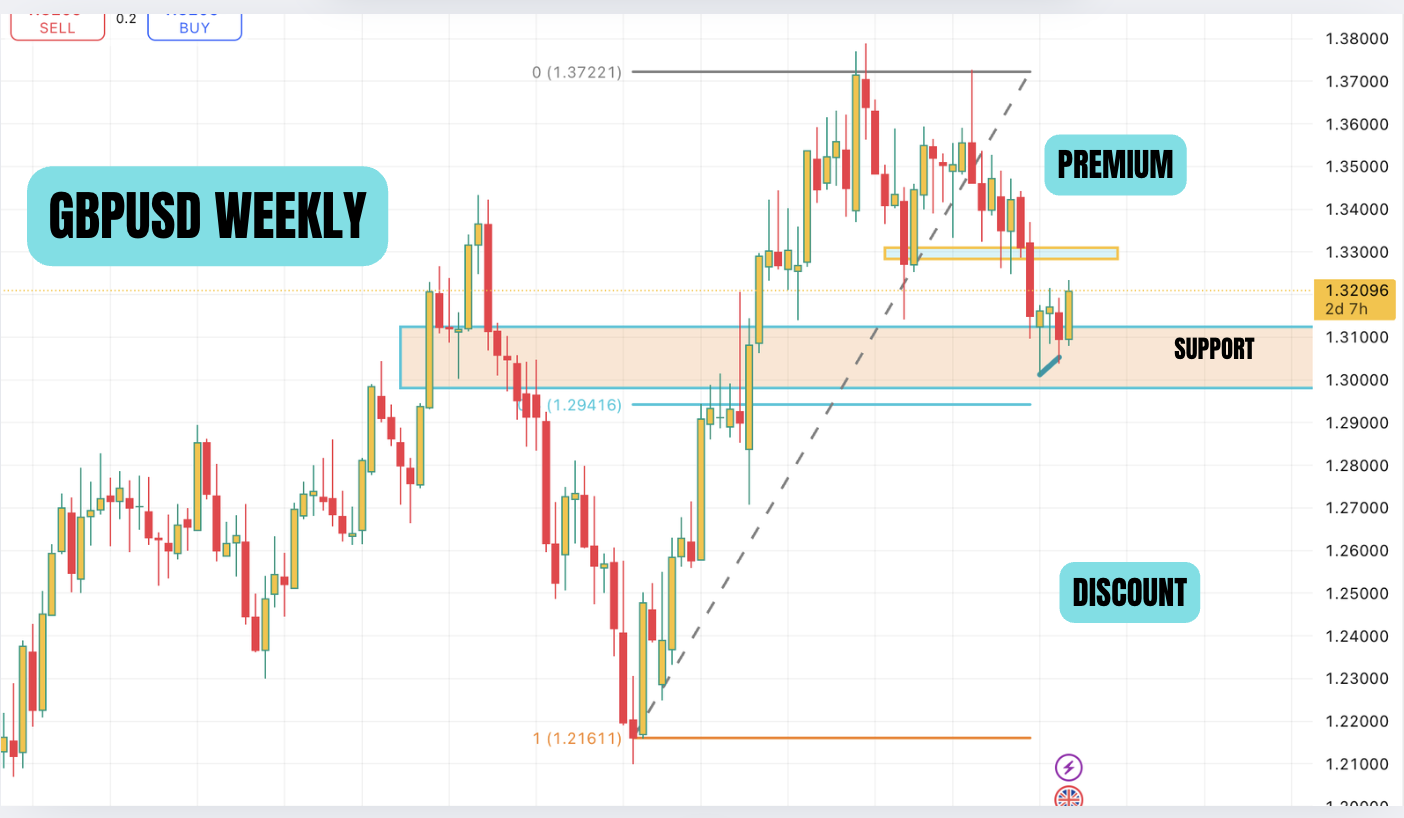
when we looked at the chart on the day before the budget, the price was had consolidated around the weekly support but the 4 hour chart was bullish and poised to go higher. When we looked for divergence, there was clear divergence in the daily chart between DXY and GBPUSD.
This prompted us a post on linkedin on the analysis and we shared that we are bullish on GBPUSD. We also entered a long position on GBPUSD on 25/11/2025. we took partial profits as price moved aggressively in the NY session. We knew that there is likely to be manipulation on the budget day.
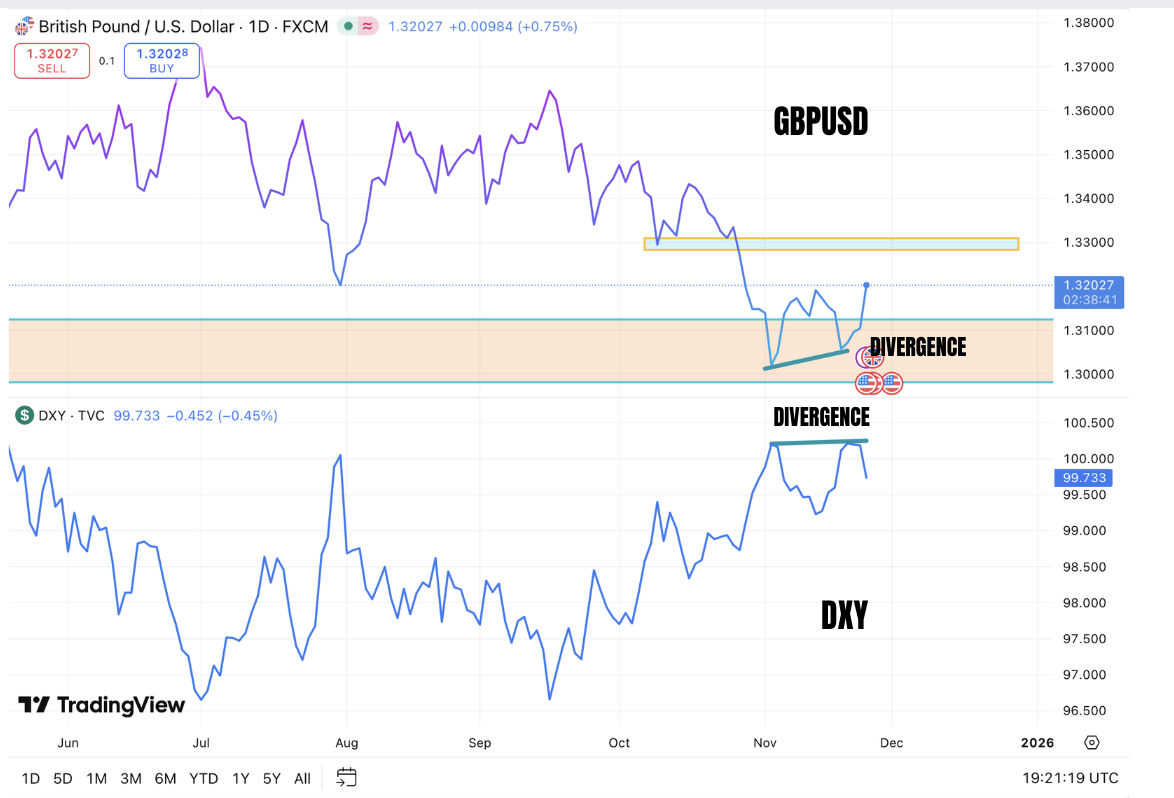
In a symmetrical market, DXY and GBPUSD are inverse to each other. So when DXY makes a higher high, the GBPUSD should make lower low. However as you can see clearly that this did not happen here. GBPUSD is making a higher low and this is likely to be manipulation.
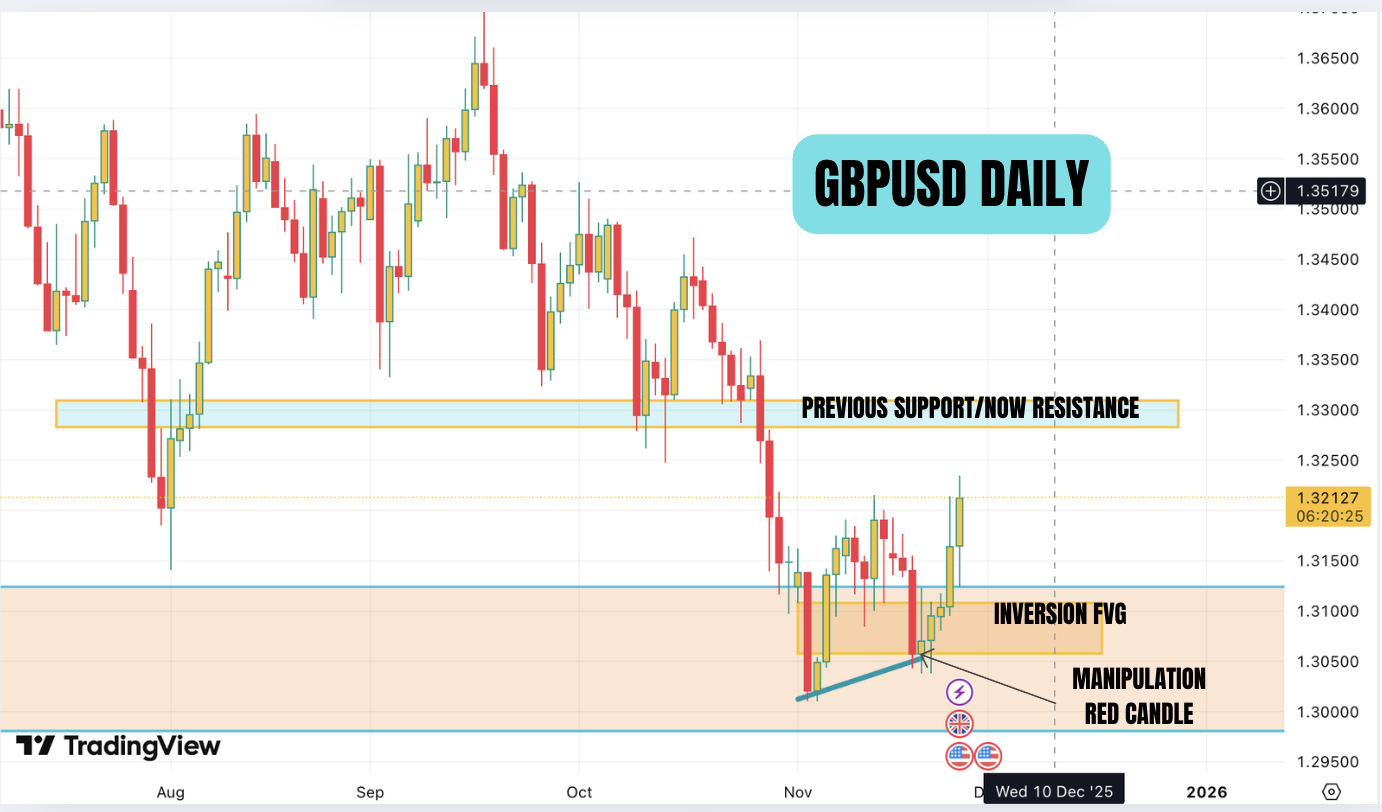
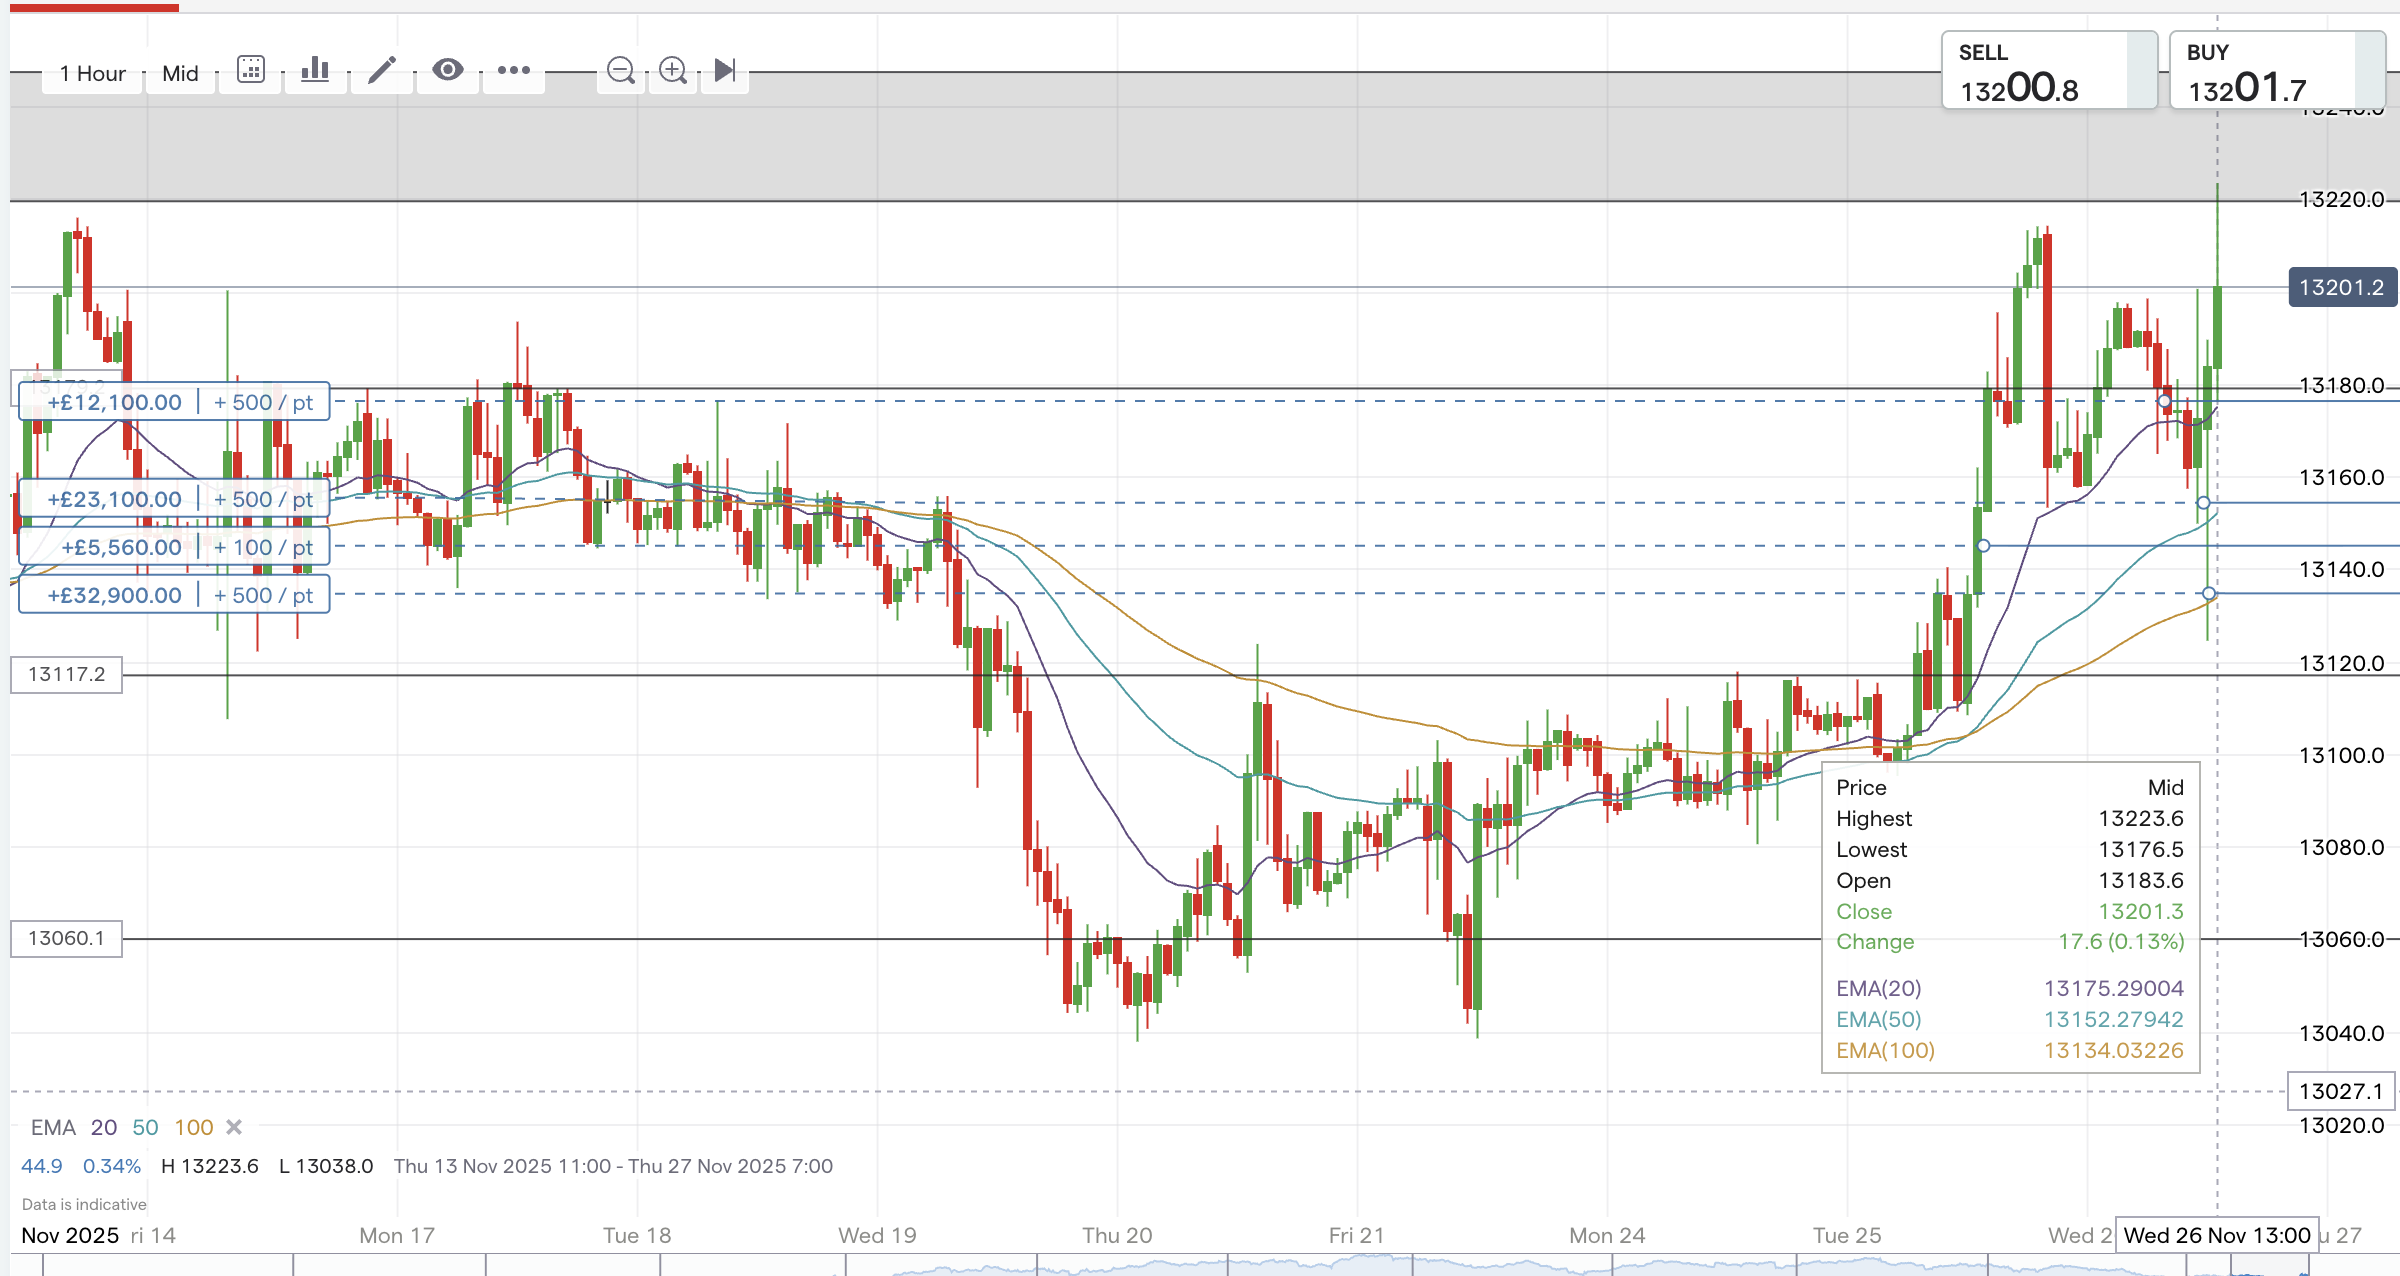
This is the GBPUSD daily chart. The price moves aggressively into the weekly support area(pink) with a bearish engulfing candle. But immediately after this the price moves up an on the 3rd day aggressively up and closes above the support. The price is now held in sort of consolidation. There is an inversion FVG formed. See price was supported by the inversion FVG during the consolidation.
we then see another aggressive move and the last candle is a bearish candle which closes at the lower end of the inversion FVG. This would have induced many participants into taking a bearish view. But look at the price action of the following candle. The next candle tries to go below the inversion FVG but immediately rejects and closes up. We have 2 further candles closing up . At this time the 4 hour structure is broken.
Once the 4 hour structure is broken we should turn cautious about our analysis. So based on the bearish sentiment, 4 hour market structure break and the divergence, we took longs on GBPUSD on the day before the Budget and on the day of the budget, we took longs on retracement in the morning and followed by whipsaw activity as there was news of budget leak.
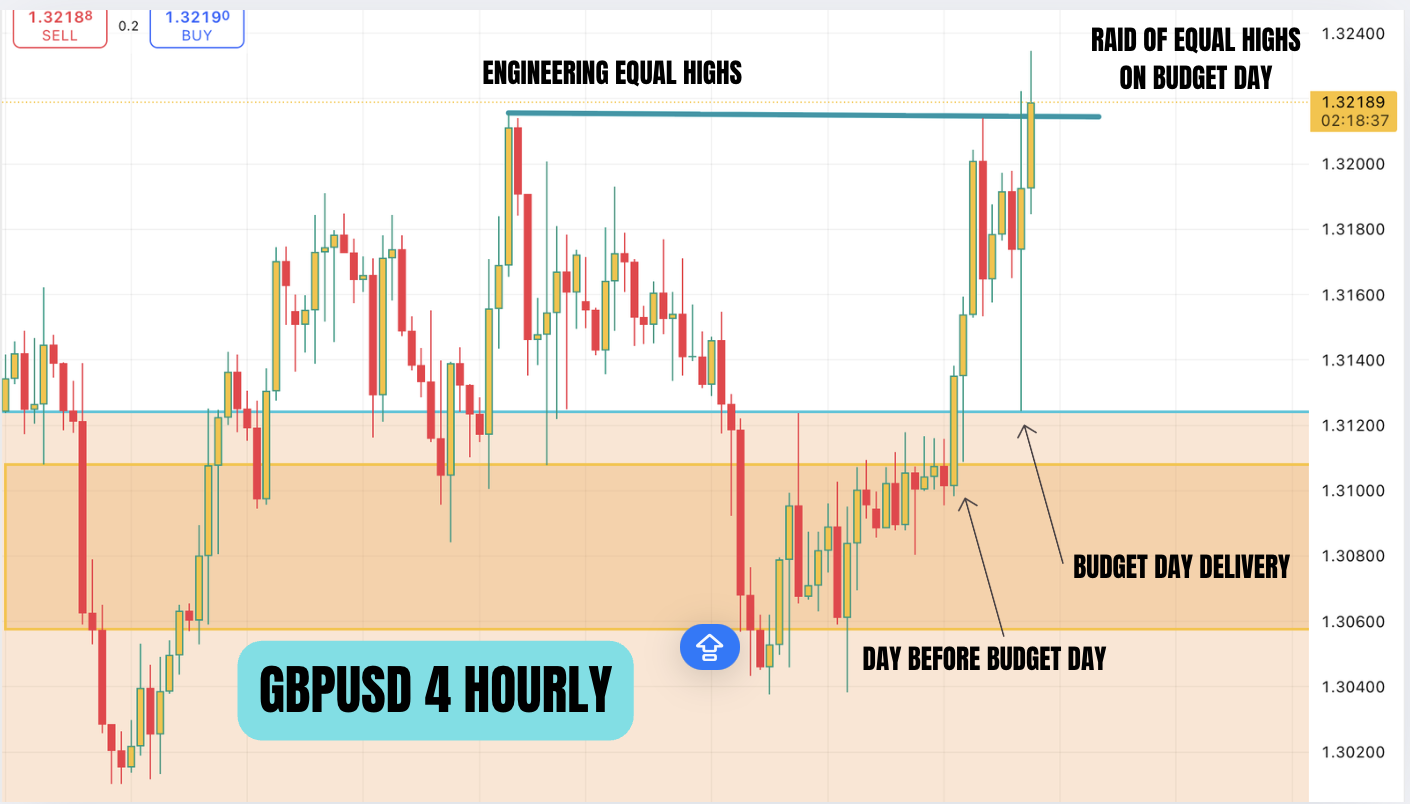
see on the day before the budget, the price moves aggressively in the new york session but the price stops just before taking the recent highs. This is engineering of liquidity and makes people think that there is resistance above that area. But this is a trap set by the Market makers. As the market makers now move the market down, it will induce retail traders to take short positions on GBPUSD.
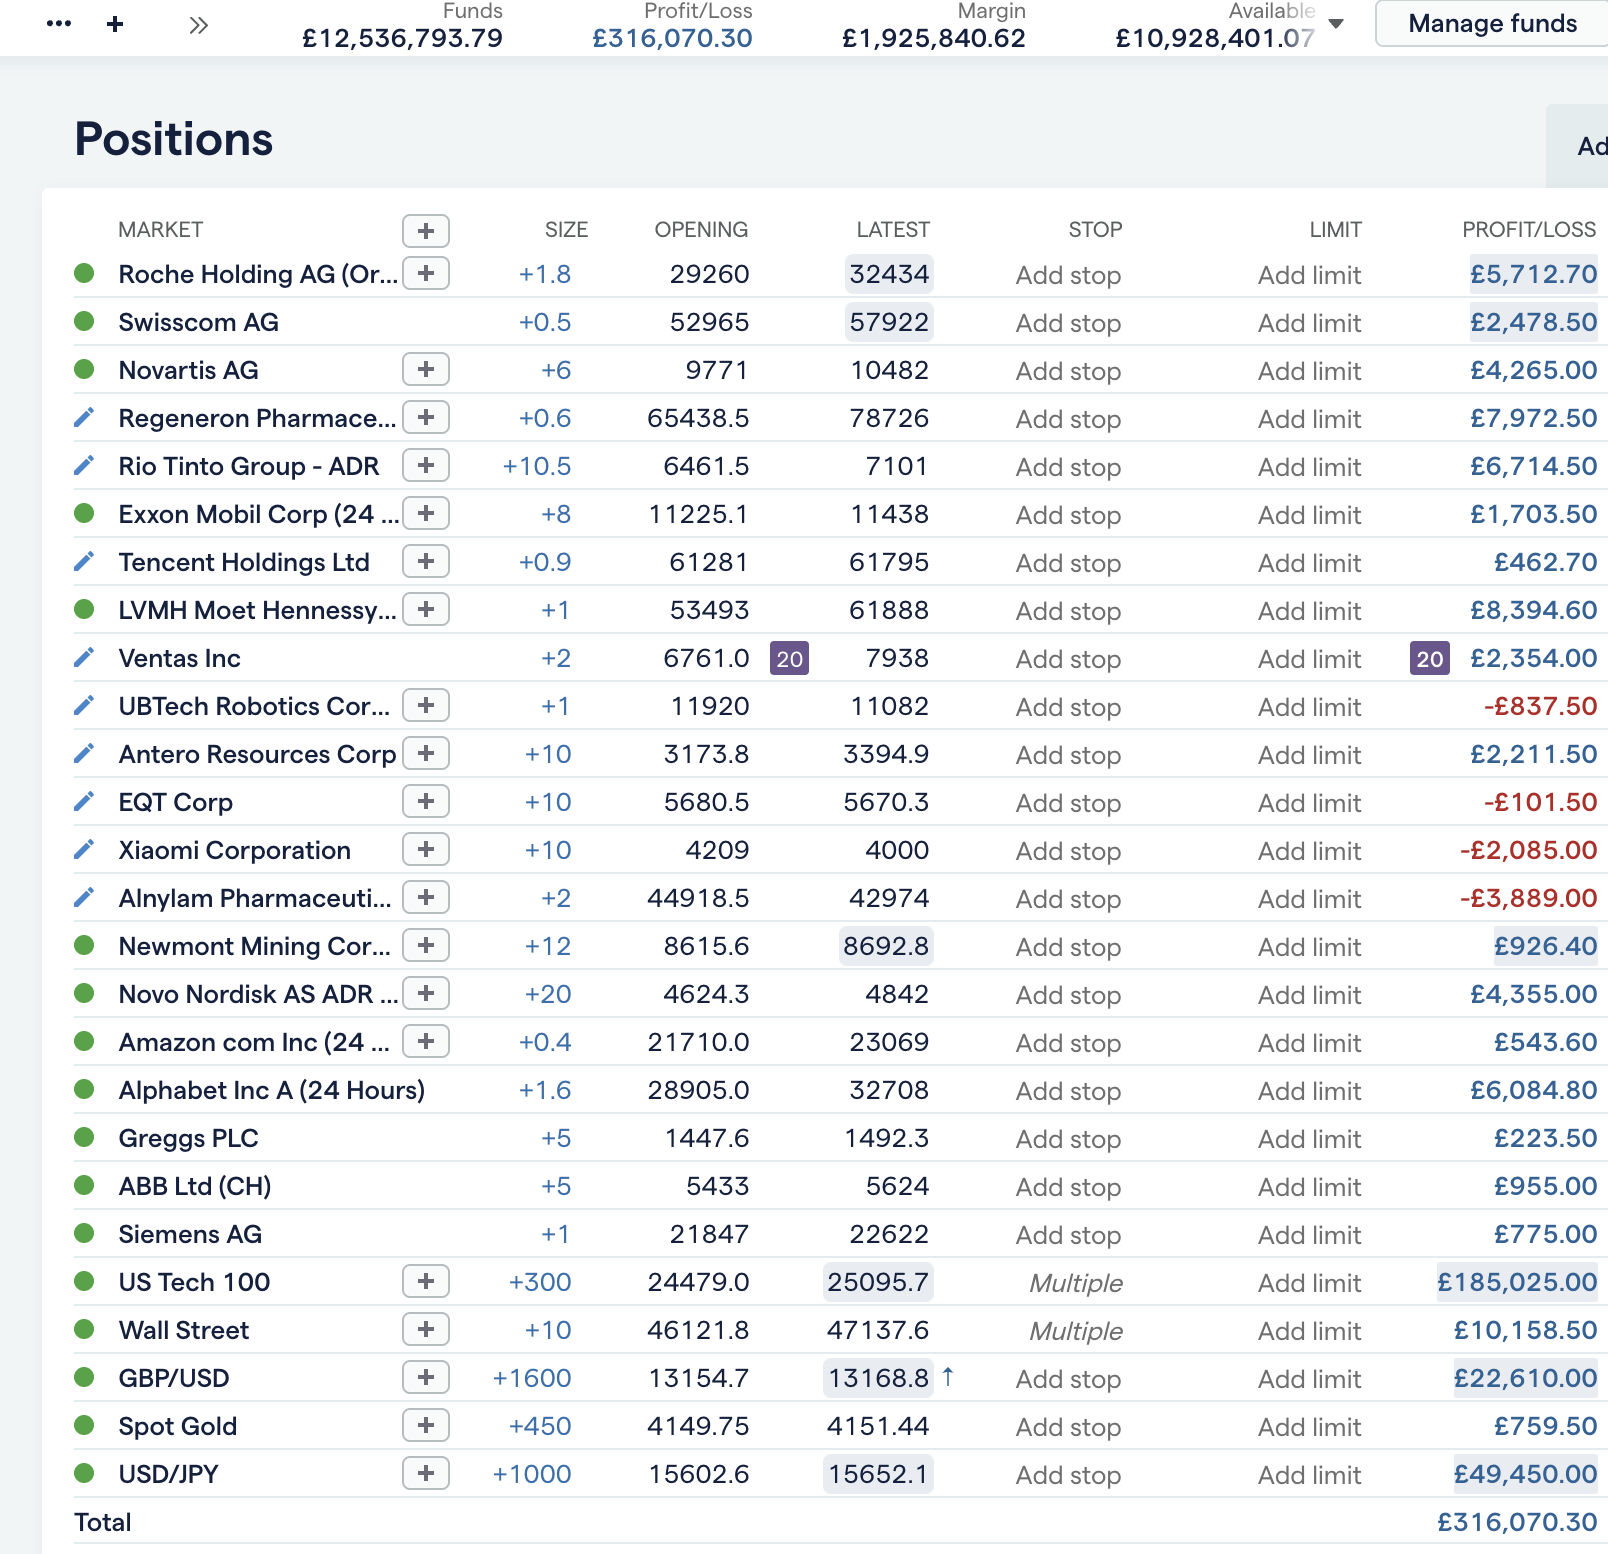
Here we showcase our trades. we only took longs on GBPUSD.
Reflection:
When majority of the participants take one positions, the market makers would move the market against them until most of them are stopped out. This could be temporary in the form of stophunt before moving in the intended direction or a deep retracement which stops many of the weak hands.
One of the things that we can use in our analysis is sentiment analysis. When majority of the participants are bullish on an asset then, we should look for technical patterns to confirm a bearish bias.
Divergence is subtle sign of manipulation. Especially in higher time frame like daily, we should always suspect manipulation.