Nasdaq Algorithmic price delivery week of Aug 8th:
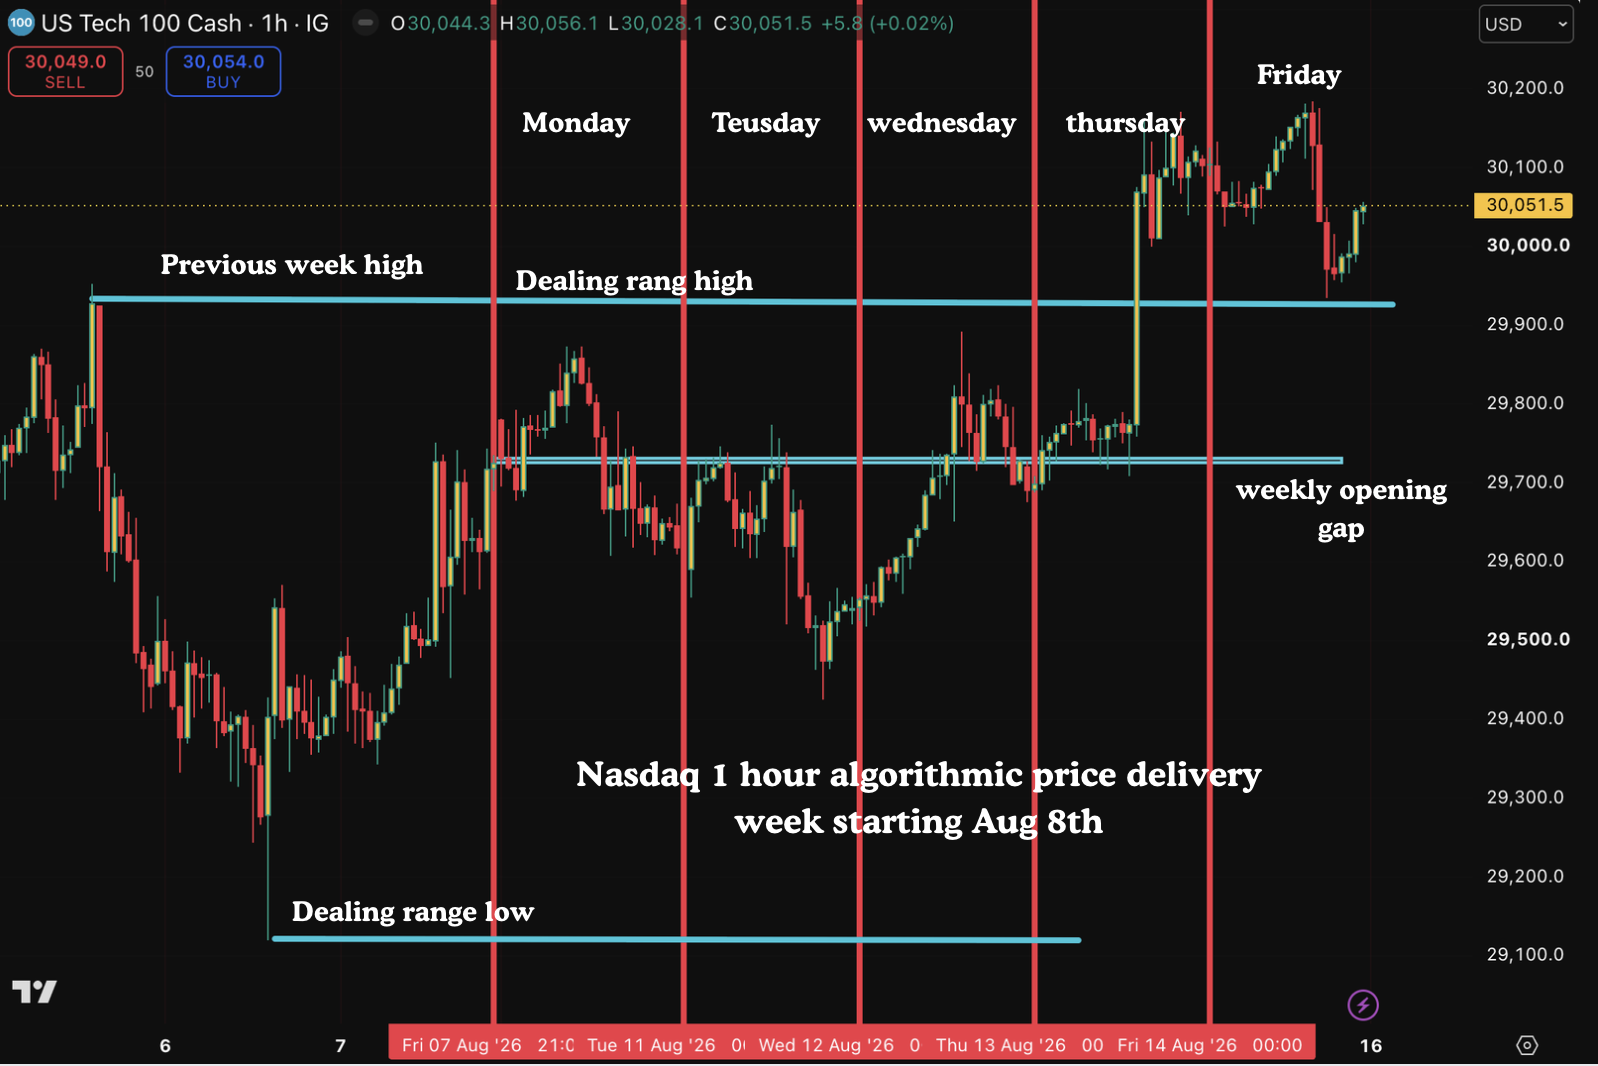
The chart shows the 1 hour price action of Nasdaq over the 1 week period starting 8th August(sun). The vertical lines has been divided by the days of the week. This is a useful exercise to do each week and see how price action is delivered and how price is paired with news event and how the accumulation has happened prior to that.
As we are on a bullish market, prior to the market open, we should be looking for( Higher probability of this event happening) the previous week’s high to be taken out. One the 1 hour chart, the Most recent. major low is the dealing range low. Previous weeks high is the most recent major high. This is the dealing range high. The dealing range varies with the timeframe.
The price was accumulated around the opening range gap and the market just stalled waiting for the CPI and PPi numbers. the price was then moved up to take out the previous week’s high and then price sort of went into consolidation. So if you were trading Nasdaq futures, you. want to try and get an entry below the opening range gap on bullish market and above the opening range gap in a bearish market.
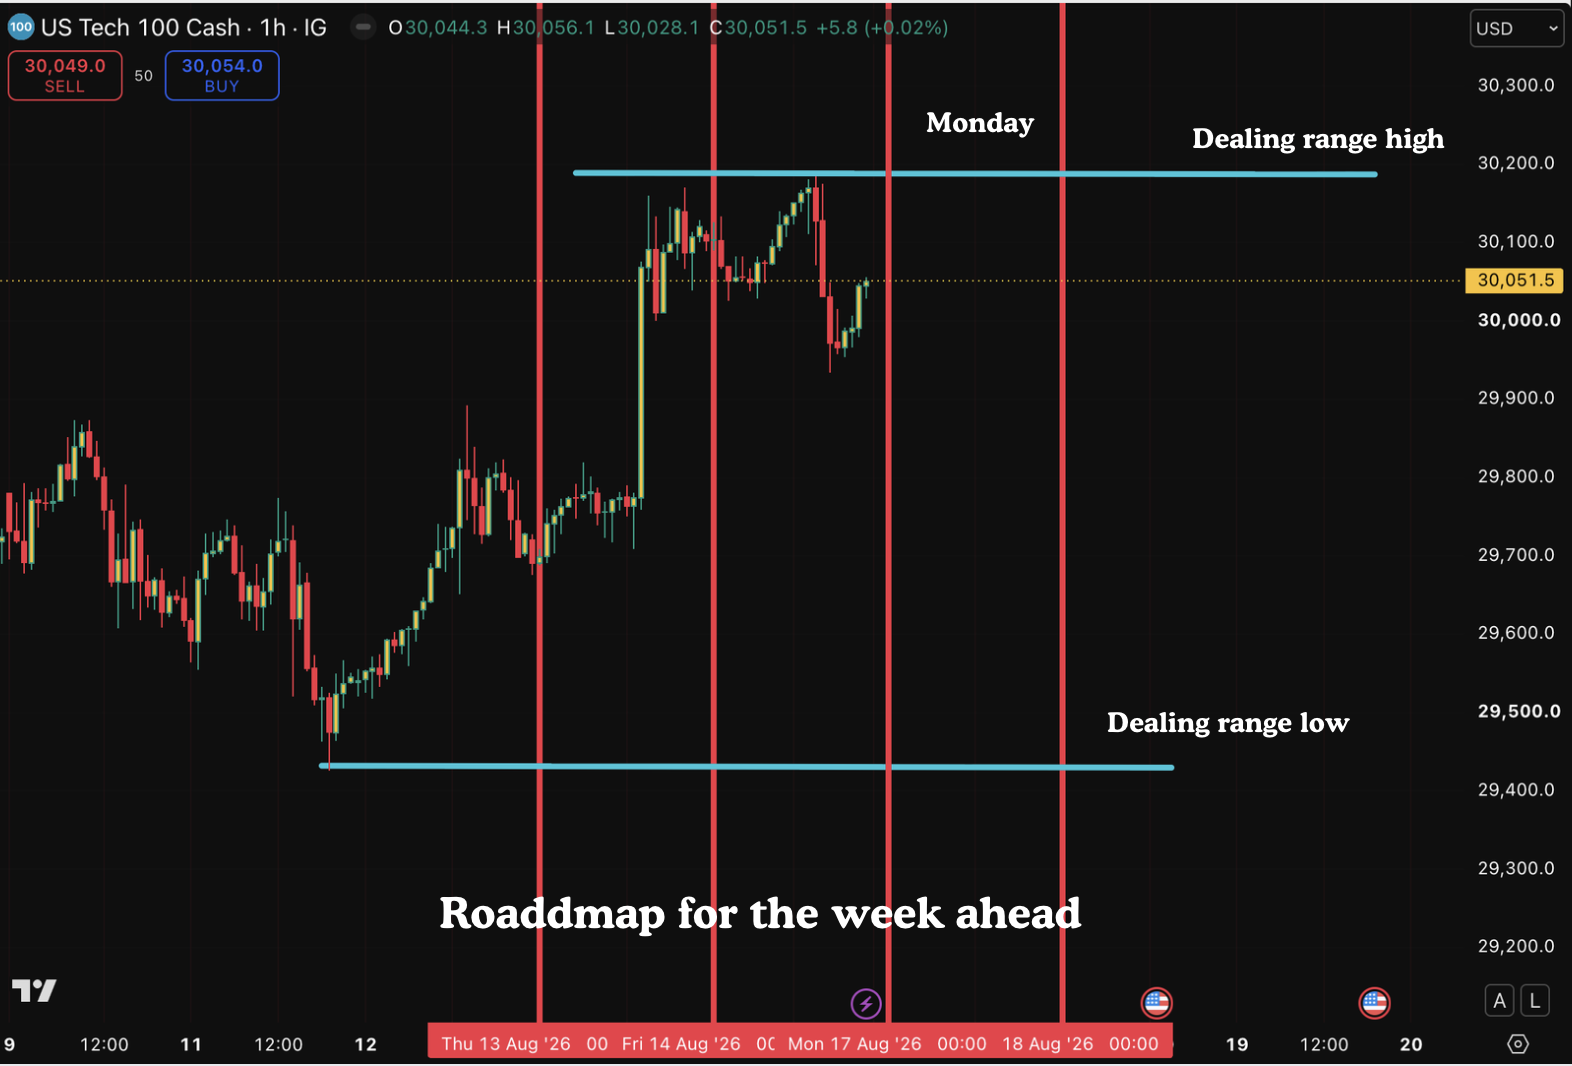
we have moved the road map forward for the week. we have a dealing range high and dealing range low. we are in a bullish condition. we divide the range into 4 quarters. we want to take longs below 50% of the range. we look for price and take liquidity which is already there in the current range or engineered during next week’s action. We then target the dealing range high and possibly the all time highs.
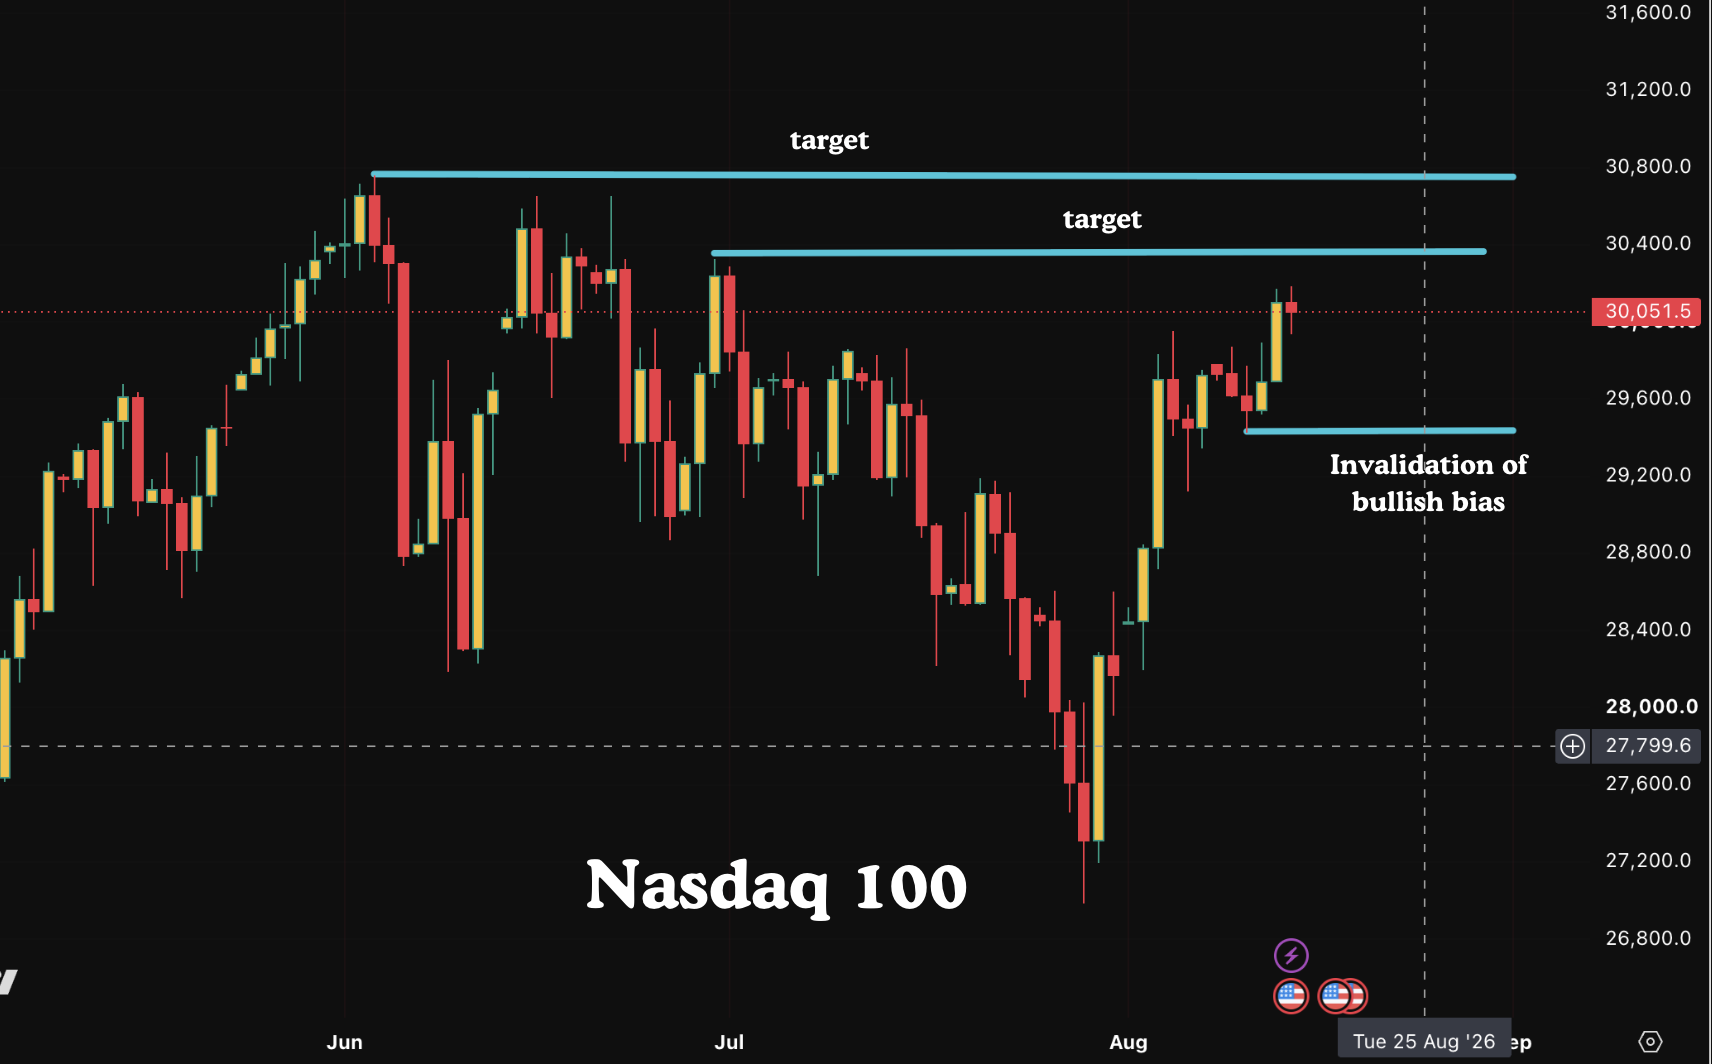
The daily chart remains our guide map for liquidity. Clearly we are expecting all time highs but anything can happen and so we have to be guided by price action. In our view as long as we are above the invalidation line, we can maintain a bullish bias and expect new all time highs. If price closes below the invalidation levels, then we will reassess our bias and review the charts again.
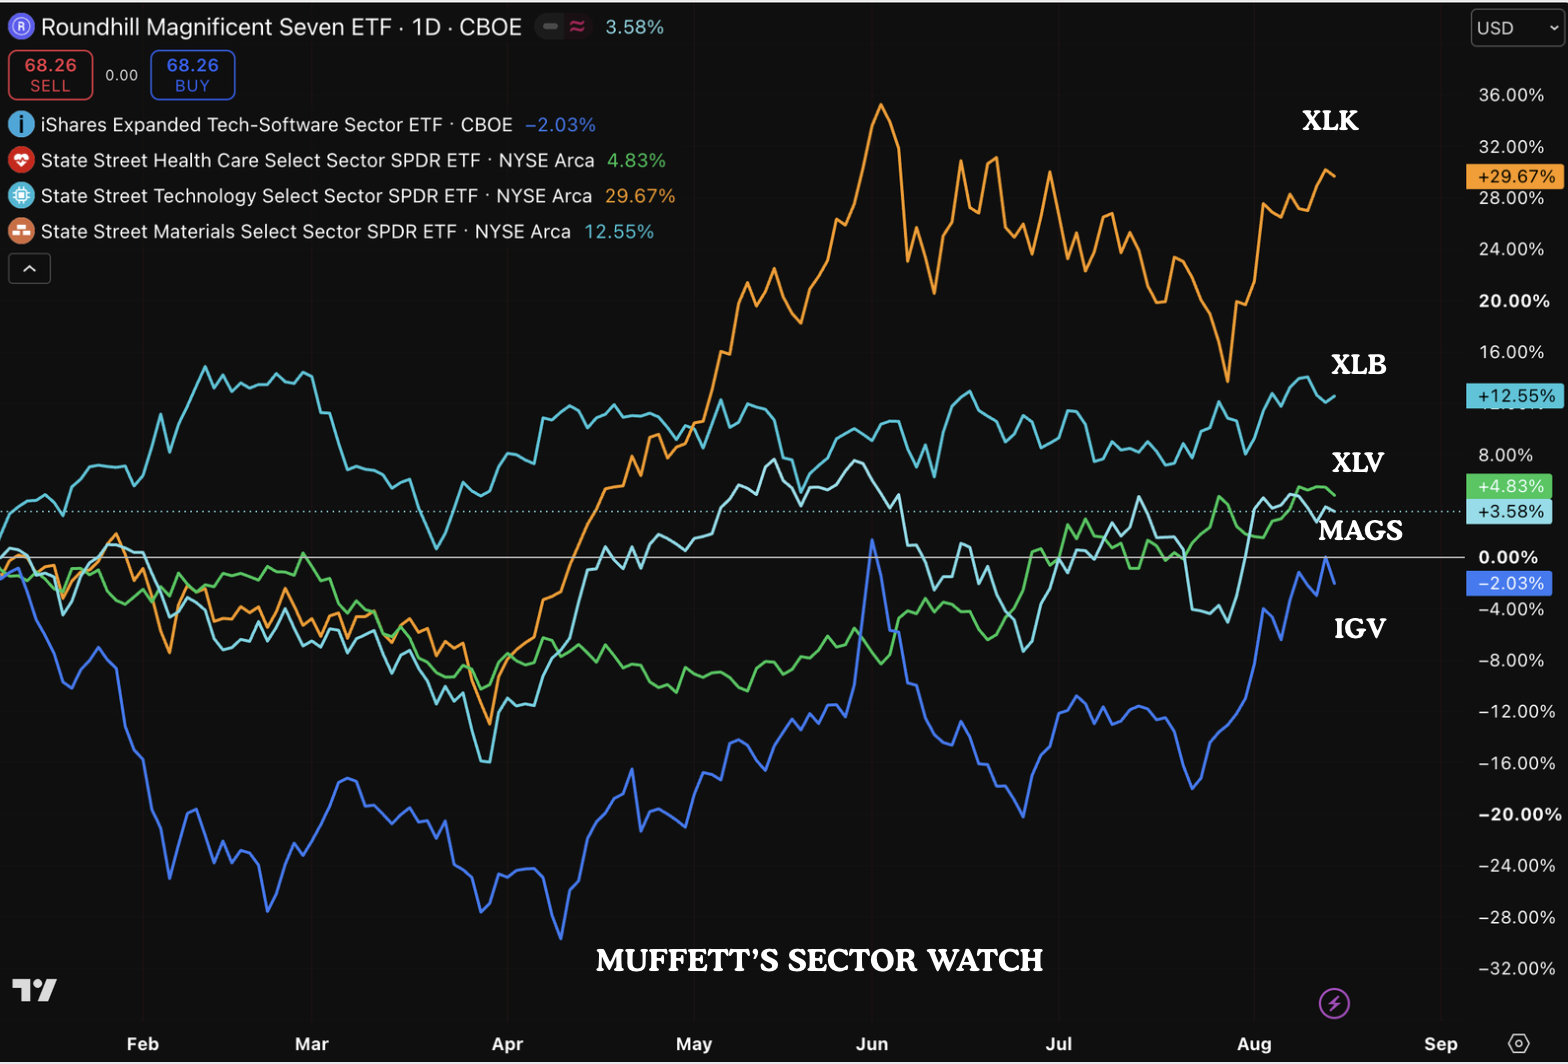
These are the sectors that we were interested in. The Magnificient 7(MAGS) need to perform. They are crouching near their all time highs and so if they were to confirm the bullish outlook by making new all time highs, then we can be confident that Nasdaq will make new all time highs as well and there will be no resistance above and there is a good chance of Nasdaq making 32800 and S&P 500 doing the 2.5 standard deviation move to 8000. We will also be watching the IGV closely. We have moved up and we need a clear break of the recent highs for a bullish bias. Finally the XLB which we are bullish about. We are still cautious even though we are long many of the miners. The reason being that the lows formed on gold is not convincing. But we have to follow our fundamental bias and price action. But we will reassess our positions if price shows weakness.
If you have come all the way here, then we want to remind you of our upcoming strategy article on how to navigate volatility following the midterm election. Although we are not saying that we know for sure that volatility will follow following the midterm elections. we are anticipating it and over the coming weeks we will be taking action as part of our strategy to deal with this volatility. This is free but you need to register for our research list on our homepage. If you are interested in this article, then please register to receive it.
All analysis done in good faith and not investment advice.
May the Peace of the Lord be with you all
