Imagining the weekly candle: Nasdaq weekend analysis
“A man who has no imagination has no wings”- Mohammed Ali
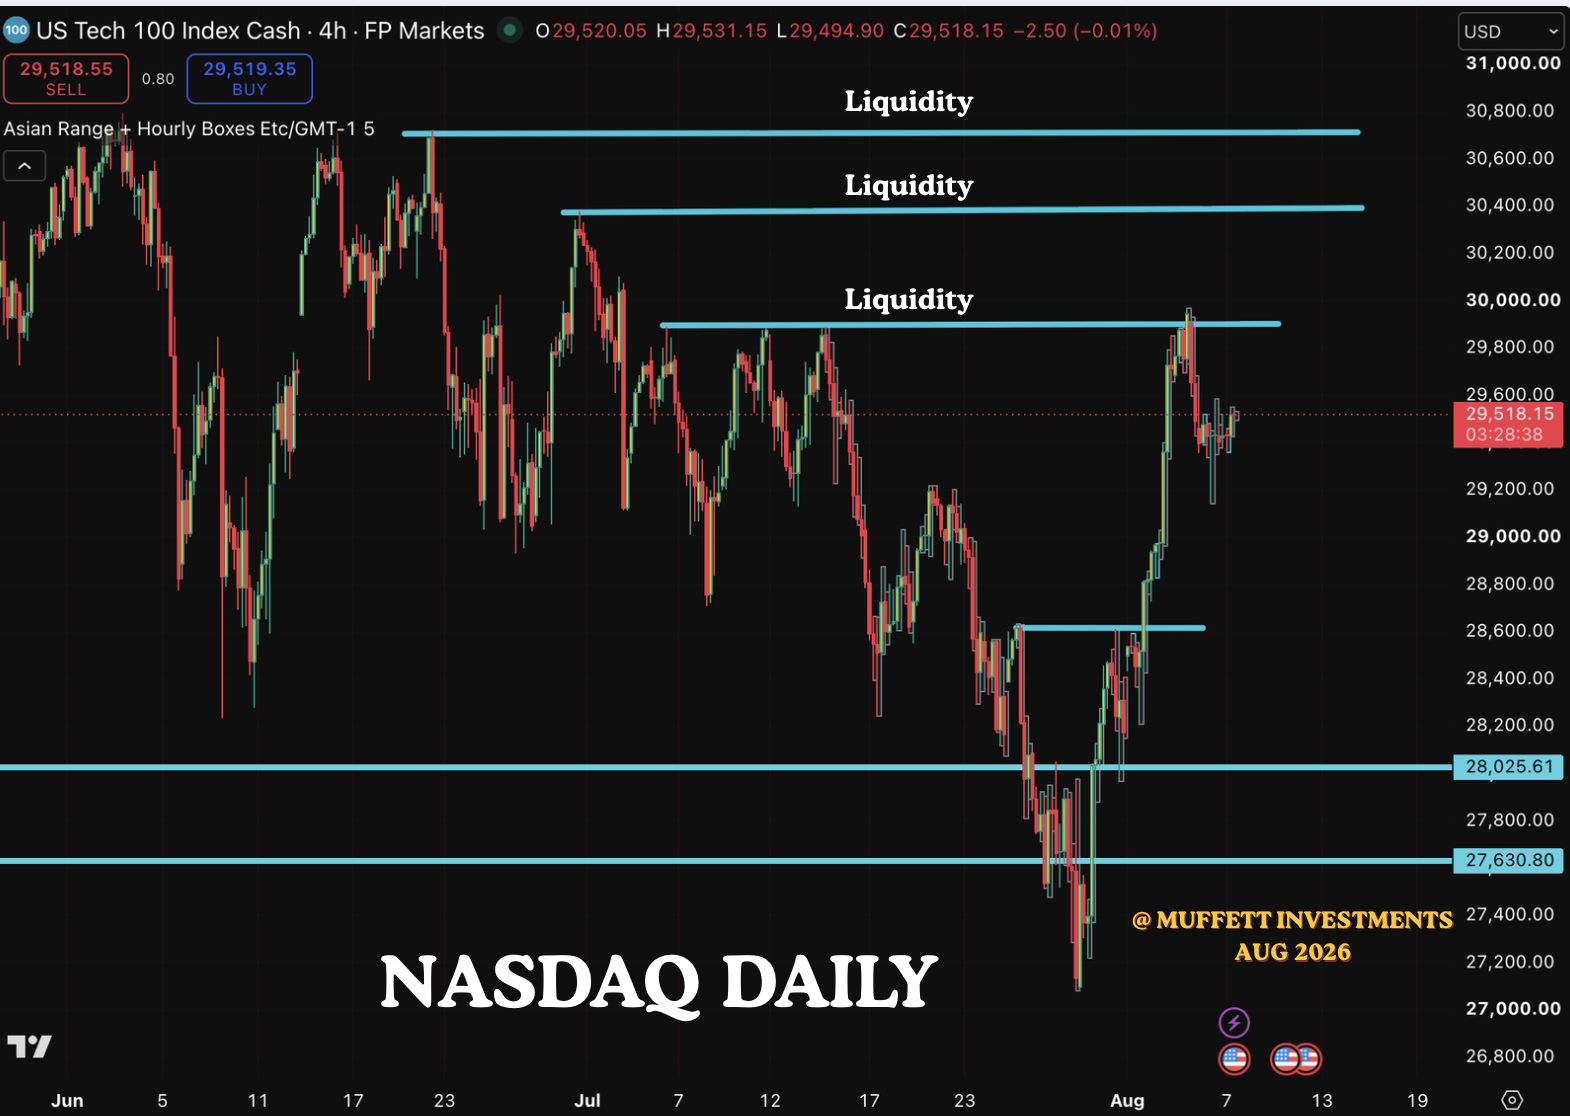
we have the daily chart here. This current daily chart looks like a typical accumulation, manipulation and distribution type of Market maker model. The price was held in consolidation and the positions were accumulated. The price was then manipulated to shake out the week hands and then the price was moved aggressively higher. We have marked out the liquidity levels and if we are able to cross the liquidity levels, then price will go to the standard deviation projection of 31850 as suggested by our previous analysis. But this is a framework (These expectations may or may not happen) for a strategy to trade the Nasdaq futures and to position ourselves in an advantageous manner by entering into stocks when there is fear in the market. Ultimately we are guided by the price action and we may need to change the framework based on the price action. This in our view is ok and the main aim is to produce positive returns in the market.
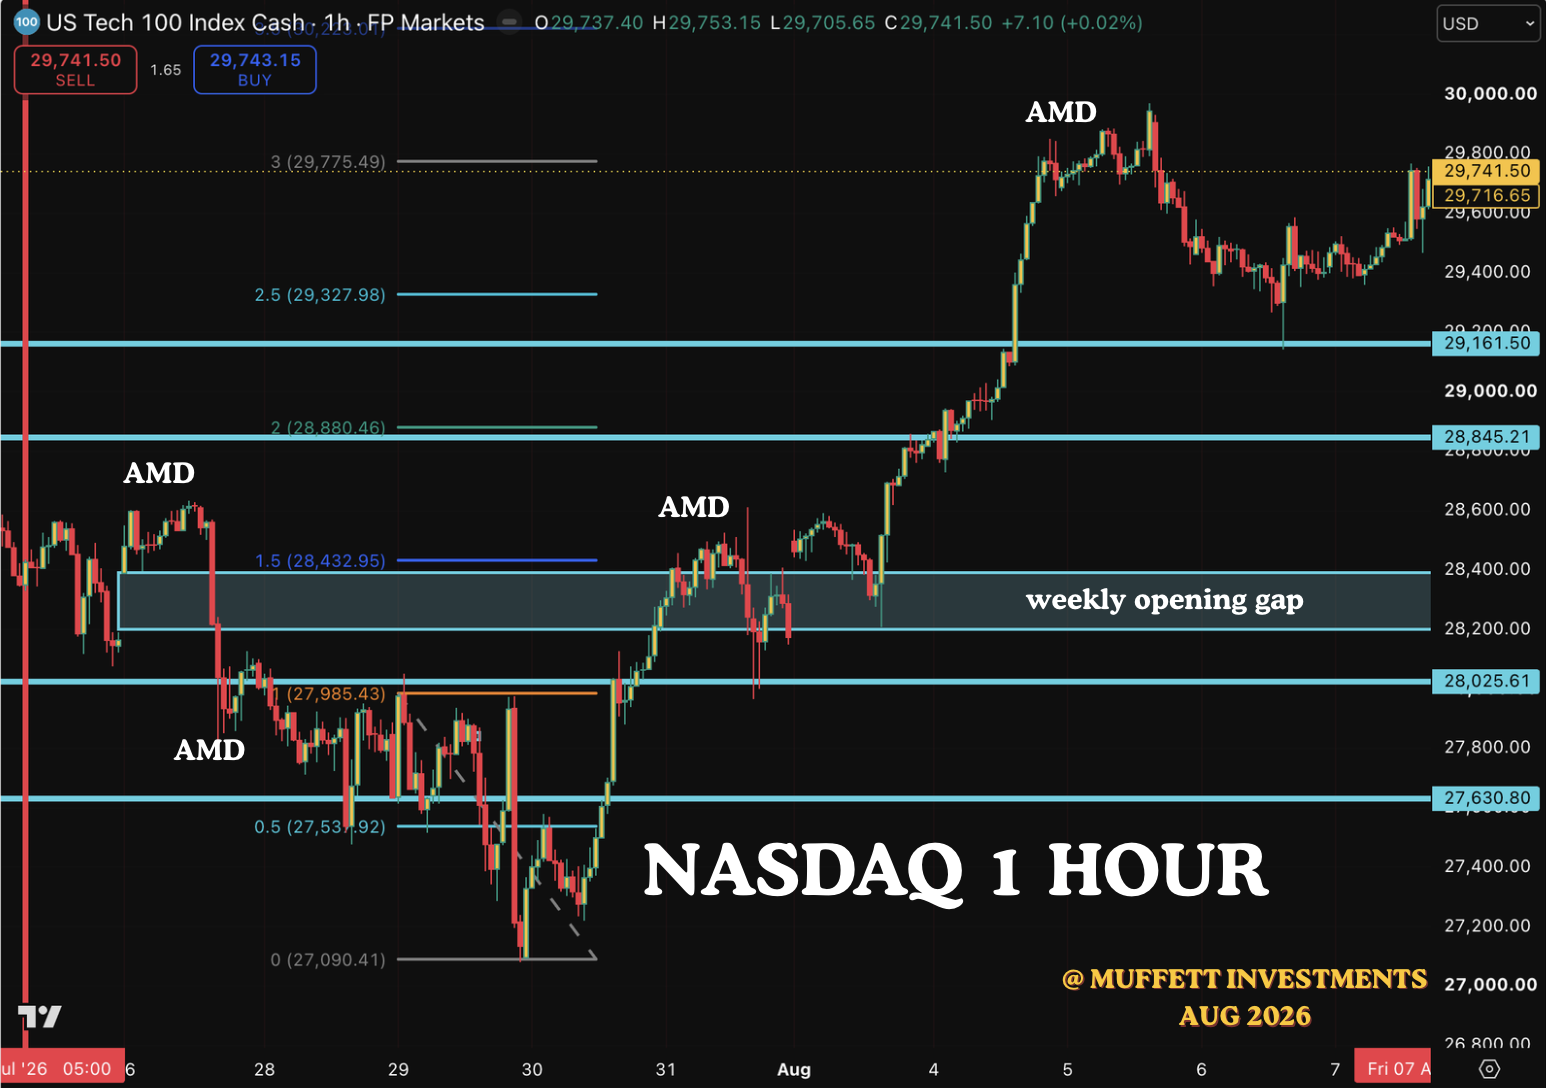
This is a quick overview of the proceedings of the past week through the Algorithmic lens. The price opened higher and induced bulls to take longs, then we have manipulation where price moved up inducing longs ((AMD LEFT MIDDLE). The price quickly fell trapping the longs and going below the opening gap. The price then accumulates again on tuesday and then It was manipulated lower again and most likely stopped out many longs and inducing shorts. Once this has happened, the price starts moving again. The shorts will continue to keep shorting while the price continues to move up and close above the weekly gap. once this happens, we are in a decidedly bullish bias and we have one last manipulation (AMD just above the opening gap).. The price then has a huge rally and continuously move higher taking out the liquidity of the equal highs ( see chart above). The standard deviation projection of the final manipulation leg gives a 3 standard deviation move.
Imagining the weekly candle:
We are now going to do an exercise. We are going to try and see how the candle will look like next week. This may look like there is no logic behind this. But let me explain. The idea here is to mark out the liquidity targets and invalidation levels for our framework next week. By mapping the liquidity targets, we are able to identify the probable highs and lows of the market. Because the market is currently poised to be bullish, we can expect either a consolidation candle or an expansion candle.
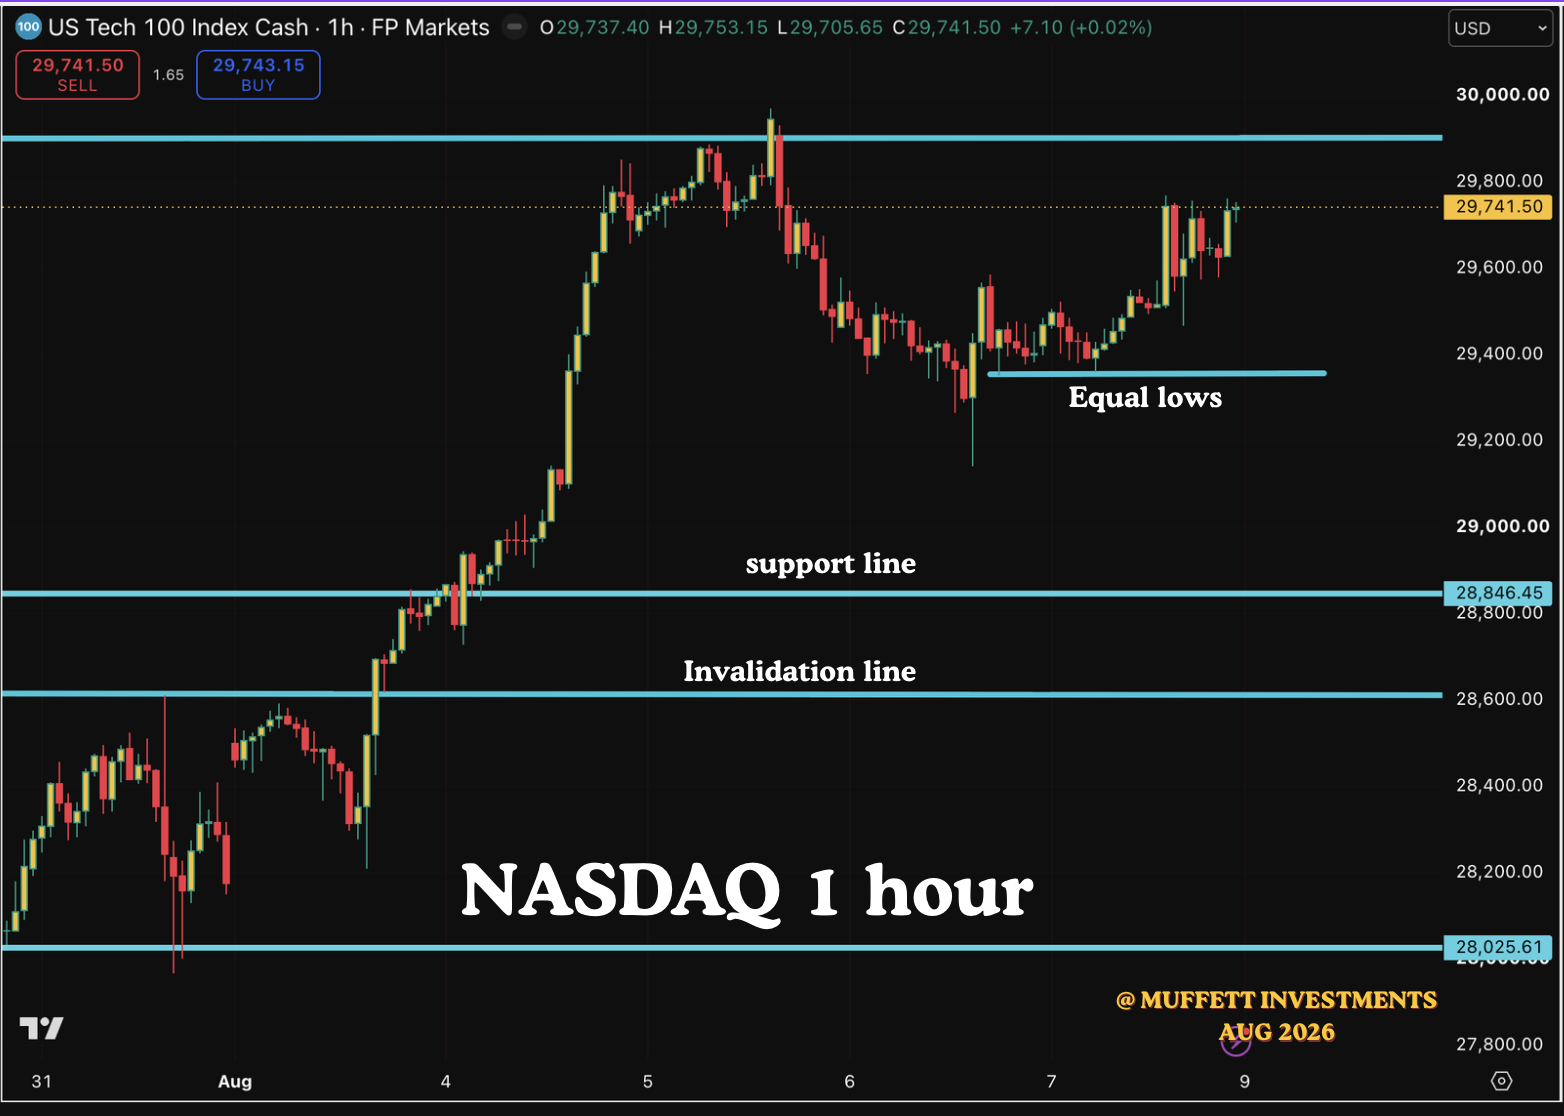
In our view, the price should not go much below the support line. Price is likely to be accumulated above the support line or ideally above the equal lows and then price manipulated down to take either the liquidity of the equal lows or the support line 28850. This where we broke out and if the market is very strong, the price will not test this support at all. So for the next week’s weekly low we can predict that it is likely to lie between the support line 28850 to 29160 which the last swing low. If the price closes below 28600, then the bullish bias is invalidated. So we now have a framework to accumulate positions based on a bullish bias. We also have an invalidation line which will guide us and we try and exit some of the short term tactical trades.
On the upside there are many number of liquidity targets and the all time highs. we think the minimum target is 30400 and then 30700 which is the all time highs. The standard deviation projection gives us a longer term target of 31850 which we think will be achieved by the end of August.
So we expect price to be manipulated lower and the liquidity be taken at lower levels before a move to the higher levels in th early part of the week. So we look for buy opportunities between 28850 and 29160. On the upside we have various liqudity levels as shown in the 4 hour chart at the top. Mapping the liquidity is the easy part. which side liquidity gets taken first is with the market makers hands. Usually on a bullish profile, sell side gets taken first followed by buyside. But it could also be the case that the market continues higher and takes buyside without taking sell side. If this happens then the market is either very bullish or the sellside will be taken at a later stage. So although we have framework and a plan in the weekend, the job during the weekday is to identify which side liquidity gets taken first.
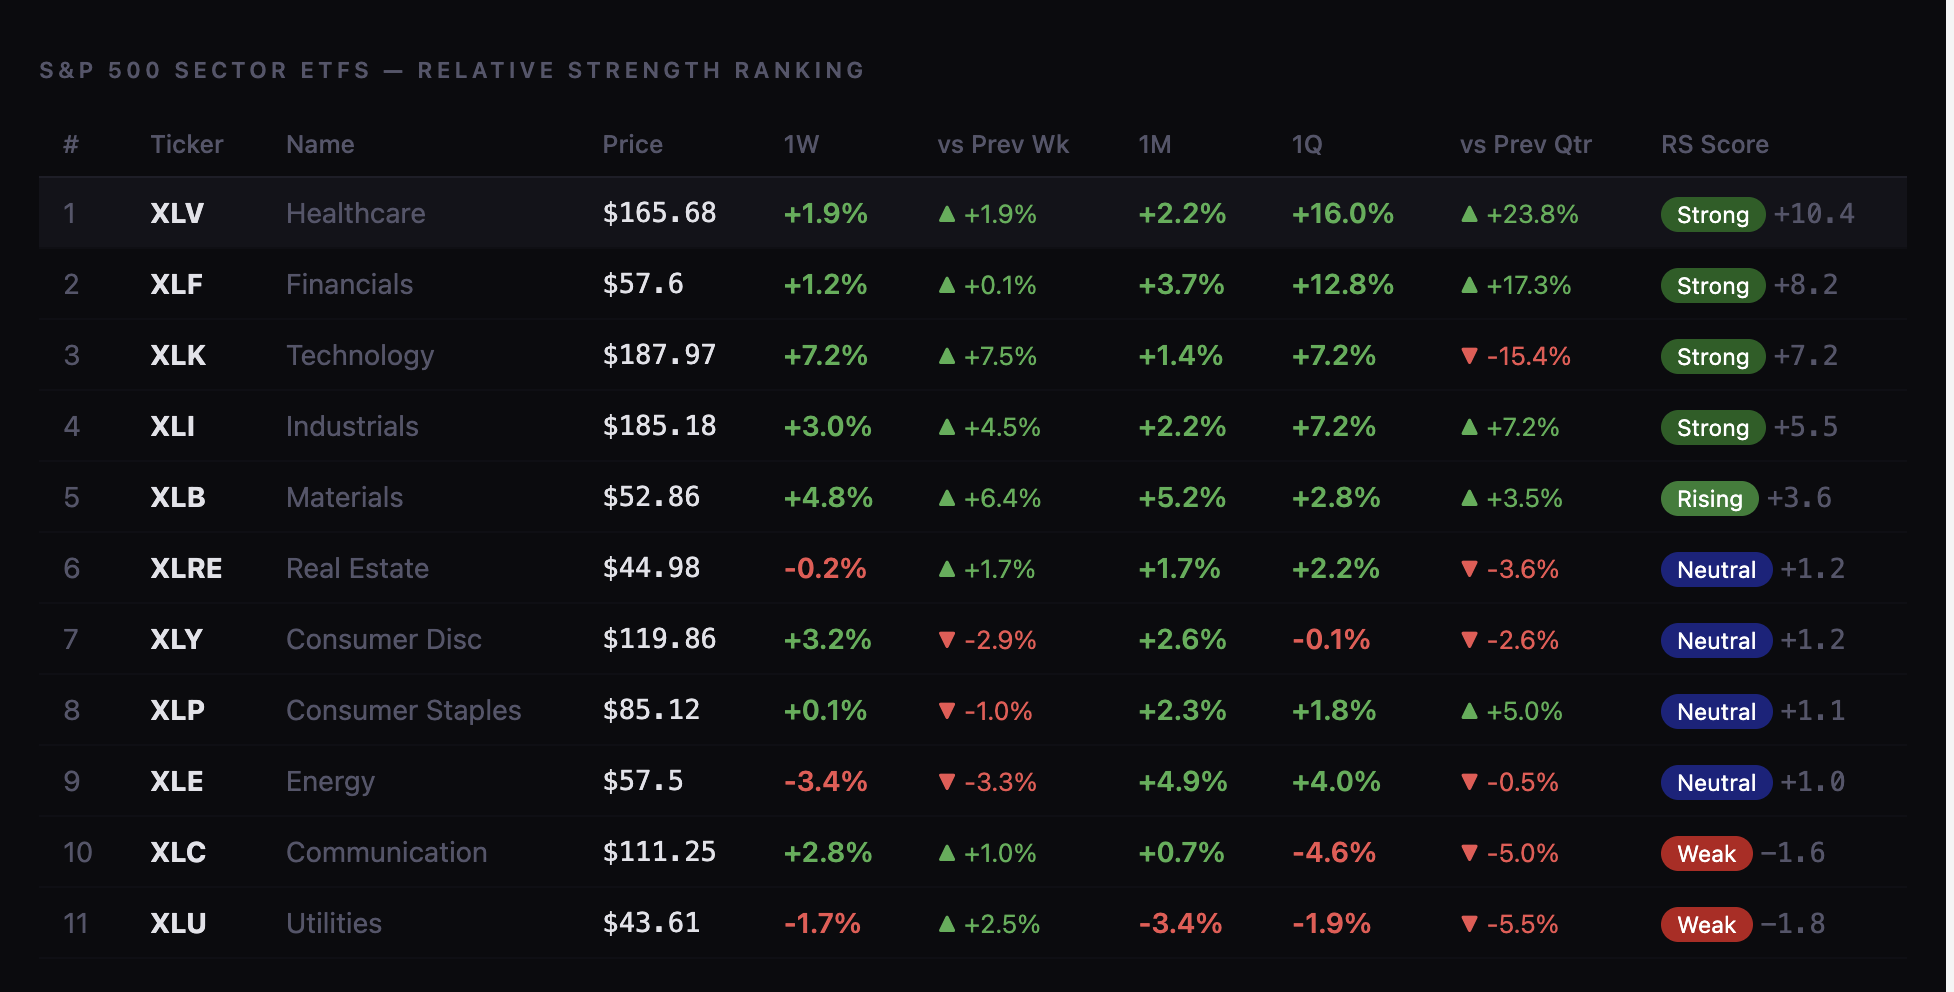
Although the tech sector leads overall, the other sectors are also performing well. In the Tech sector, we want to focus on the MAG7 companies in particular Microsoft, Amazon and Alphabet. we also like IGV. We will take position in Roper technologies next weeks provided we have good market action. In the IGV the stocks we identified previously Atlassian, Servicenow and Salesforce are acting well. We have currently servicenow and salesforce in our model portfolio. We also like some of the chip stocks like AMD and Applied Materials.
All Analysis done in good faith and not investment advice.
May the Peace of the Lord be with you all.
