Nasdaq analysis- 6/12/2025 preFOMC and NFP edition:

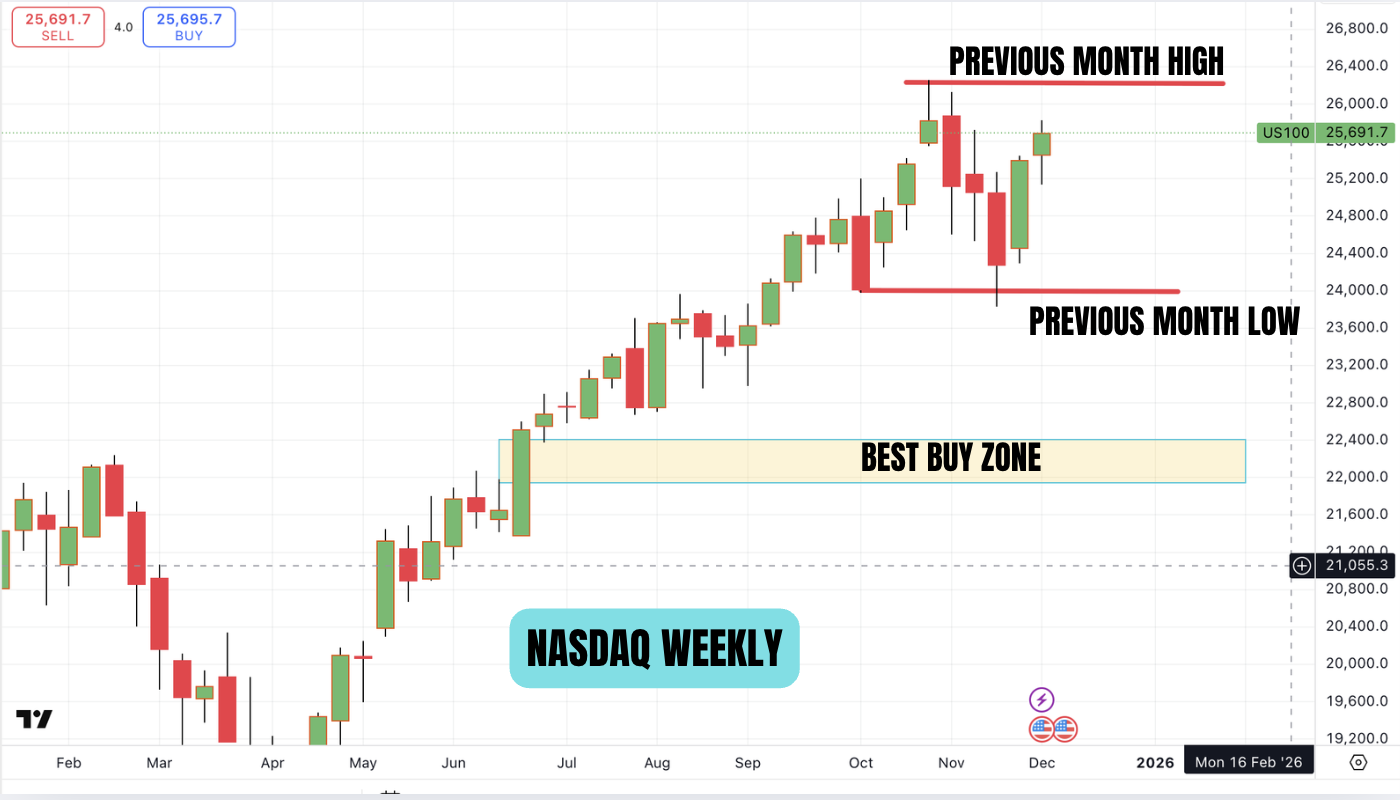
We are first presenting the daily chart and weekly chart. If we see the weekly chart first, we can see that the price took a previous month low and now has moved up and is looking like it will take the previous month high. Another way to look at it is shown in the daily chart. The price took sellside liquidity and now targeting the buy side liquidity. An important idea in algorithmic trading is ‘The price seeks liquidity and the price goes from internal range liquidity to external range liquidity’.
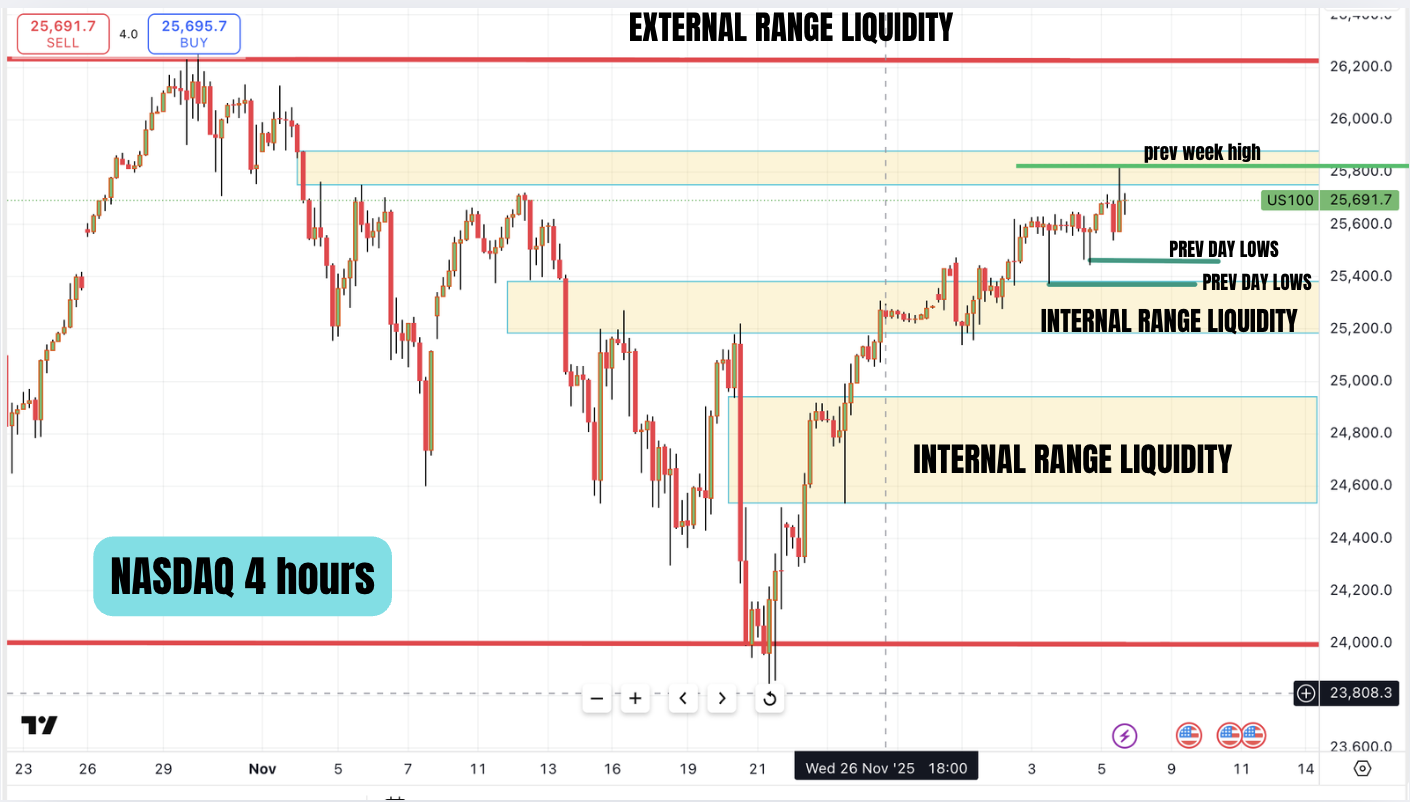
We are now going to repeat our thought experiment. we are going to imagine how the next weekly candle will be delivered. In a bull market the price goes from the internal range liquidity to external range liquidity. The external range liquidity could be in the form of the previous week’s high or a previous months high. Here we present the 4 hour chart marking out the internal range liquidity and external range liquidity. We have the FOMC on Wednesday and the NFP on Friday. The market makers can use a multitude of manipulation possibilities using the volatility associated with both. Our job is to try and position ourselves to identify the manipulation and participate in the distribution. Our higher time frame trend is bullish ( The market maker intentions). So we need to look for buy entries in the areas marked as internal range liquidity.
Our ideal scenario would be for price to be manipulated before the FOMC and at the time of FOMC into our internal range liquidity areas. The price then moves higher to take out external range liquidity.So until the FOMC on wednesday ideally we sit outside ( to be able to have a unbiased view) or we do only scalping trades.
If external range liquidity is taken first, then we wait for price to break structure and we look for price to be manipulated back into internal range liquidity. Our biggest edge here is the market maker intentions(here it is very obvious) and liquidity.
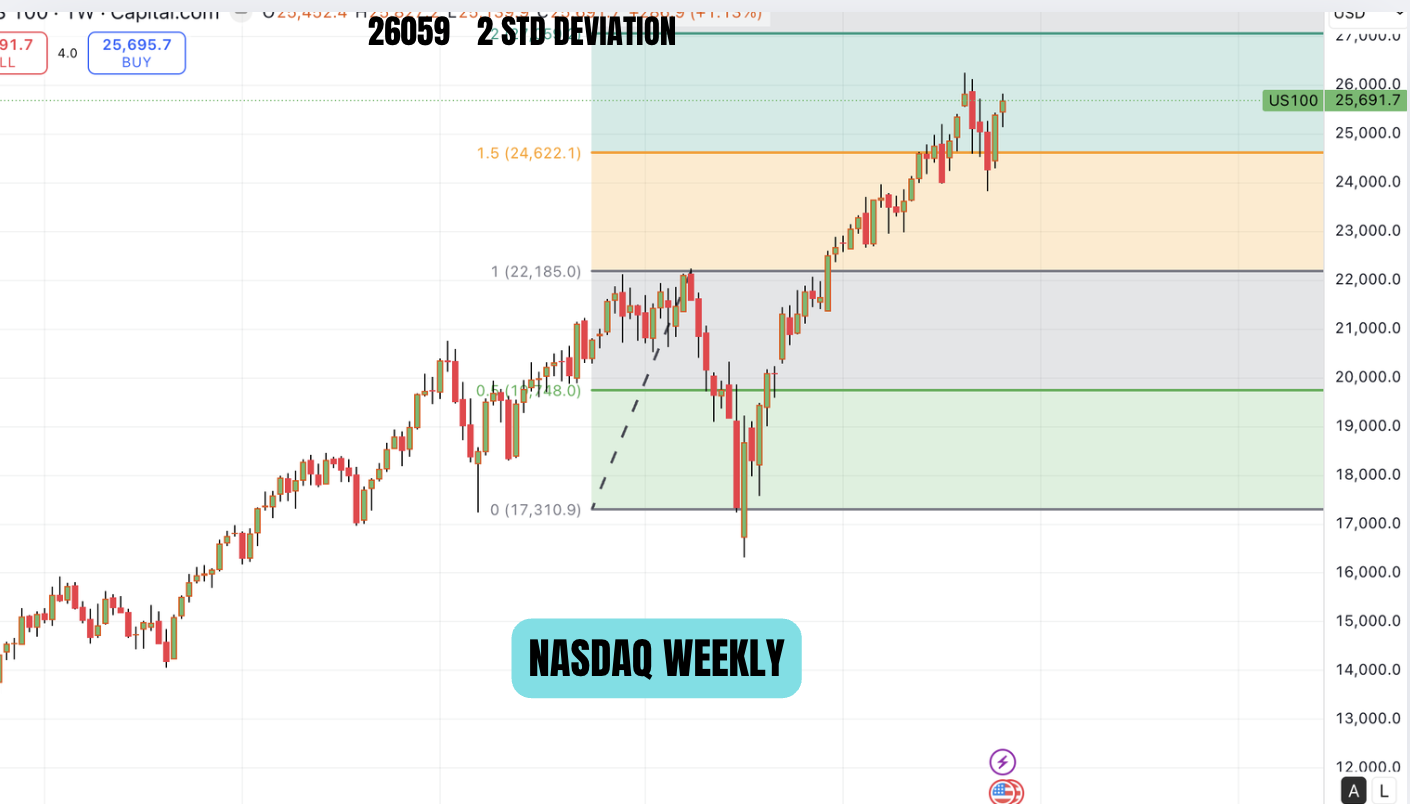
Finally where can price go if the previous month’s high is taken out. We use standard deviation projections for this. Using that we can look for a move to 26058. May peace be with you all.
Disclaimer: Analysis done in good faith and is not investment advice. This is for educational purposes only.