GOLD analysis 7/12/2025:

We are doing this analysis on the weekend before the FOMC and NFP. This is the second week of December and it is highly likely that if gold does not move out of this range this week, then it will remain in the current range for the rest of this year. We however are still hopeful that price can move out of the current range. we are overall bullish and the market structure is currently bullish on the daily, weekly and monthly time frame.
A key concept in algorithmic trading is for an aggressive move to happen, price should first consolidate and then take out stoplosses before the move.
We have been in the current dealing range since the 6th of October. we do have news drivers that may be big enough to move gold out of the current dealing range.
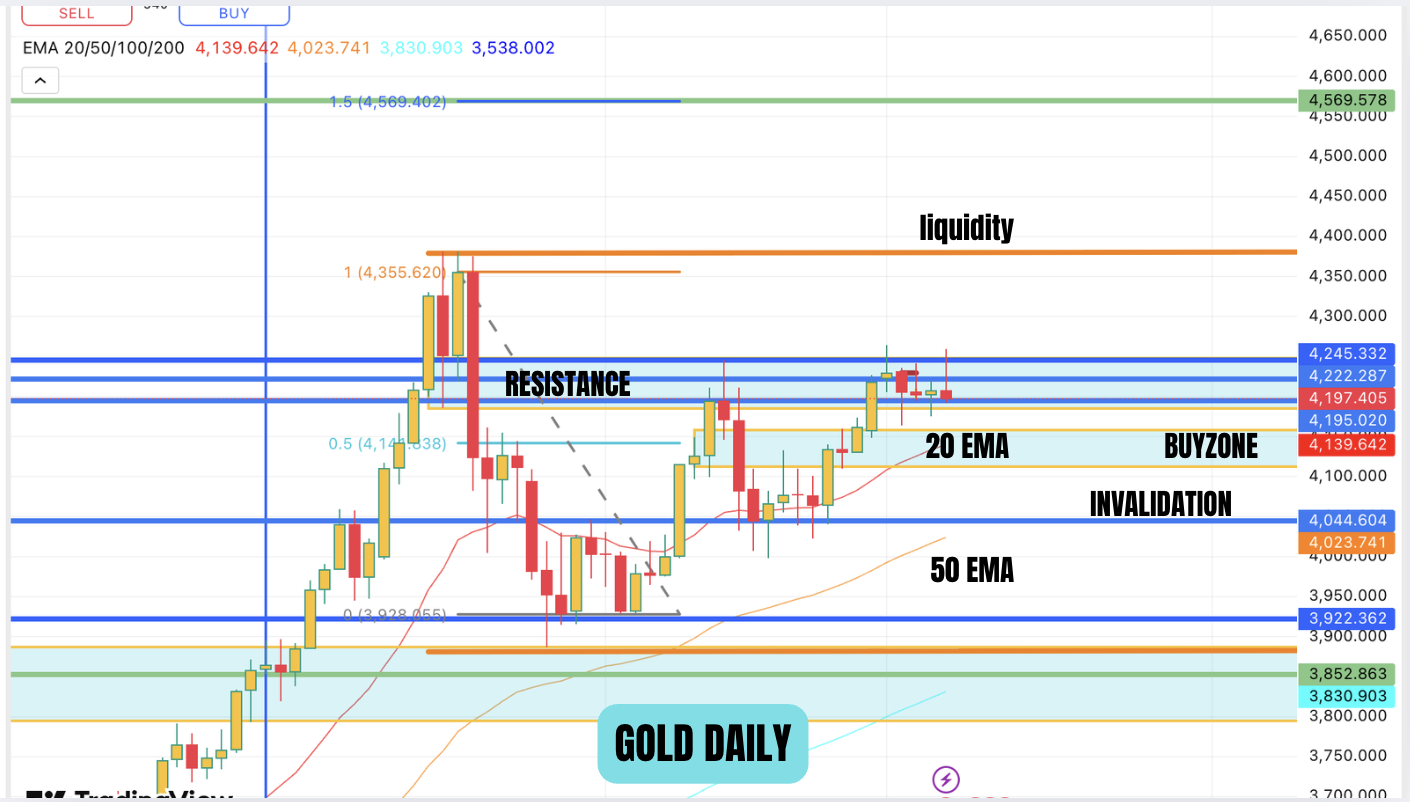
we will be looking at the daily chart first. The Orange lines represent the current dealing range which we ahve been in for the past 2 months. The price is bullish on the daily time frame as price has made higher lows and higher highs. The price is also above the 20 day EMA which is bulish. The price is currently at a significant resistance area. Price has consolidated in this area through out last week. If you see closely on Tuesday of last week price moved down (red pinbar) and stopped just short of the buyzone. This is engineering of liquidity in our view. So next week we are expecting price to be manipulated down to the buyzone and induce a bearish sentiment and trap traders on the short side and then move the price aggressively. If price CLOSES below $4044, then bullish bias would be invalidated.
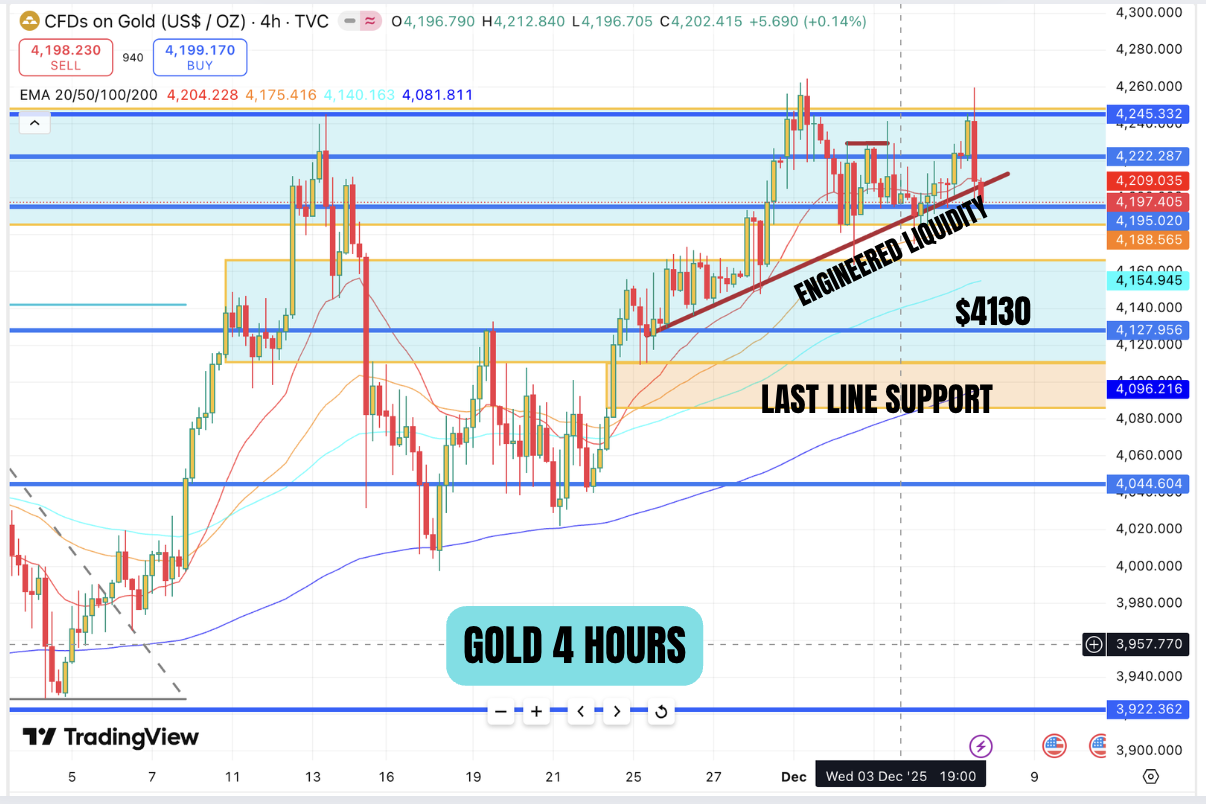
The 4 hour chart shows the engineered liquidity in the form of trendline liquidity just above the buyzone. There is also a 4 hour imbalance just below the buyzone and this will be the last line of support. The pivot line is at $4130. Low risk entries are around this line and below. So if we wrong and the market is in fact bearish and price goes below the last line support, it is very likely that price will go below $4000 and maybe $3922. Although we do have a bullish bias, we have to also consider other possibilities.
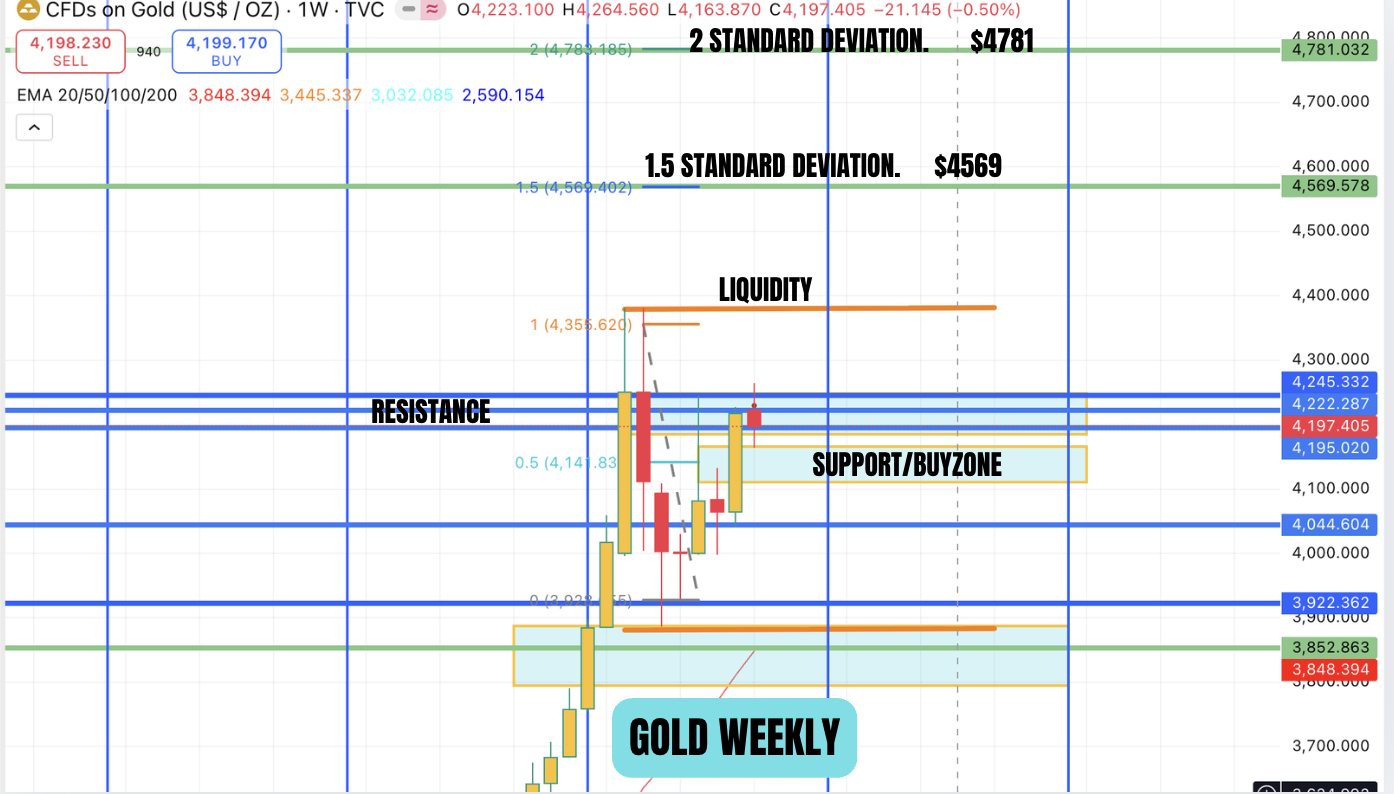
If we are right and price takes out liquidity at the top, then where can price go. We have drawn standard deviation projections for this and the 1.5 standard deviation is $4569 and the 2 standard deviation projection is $4780.
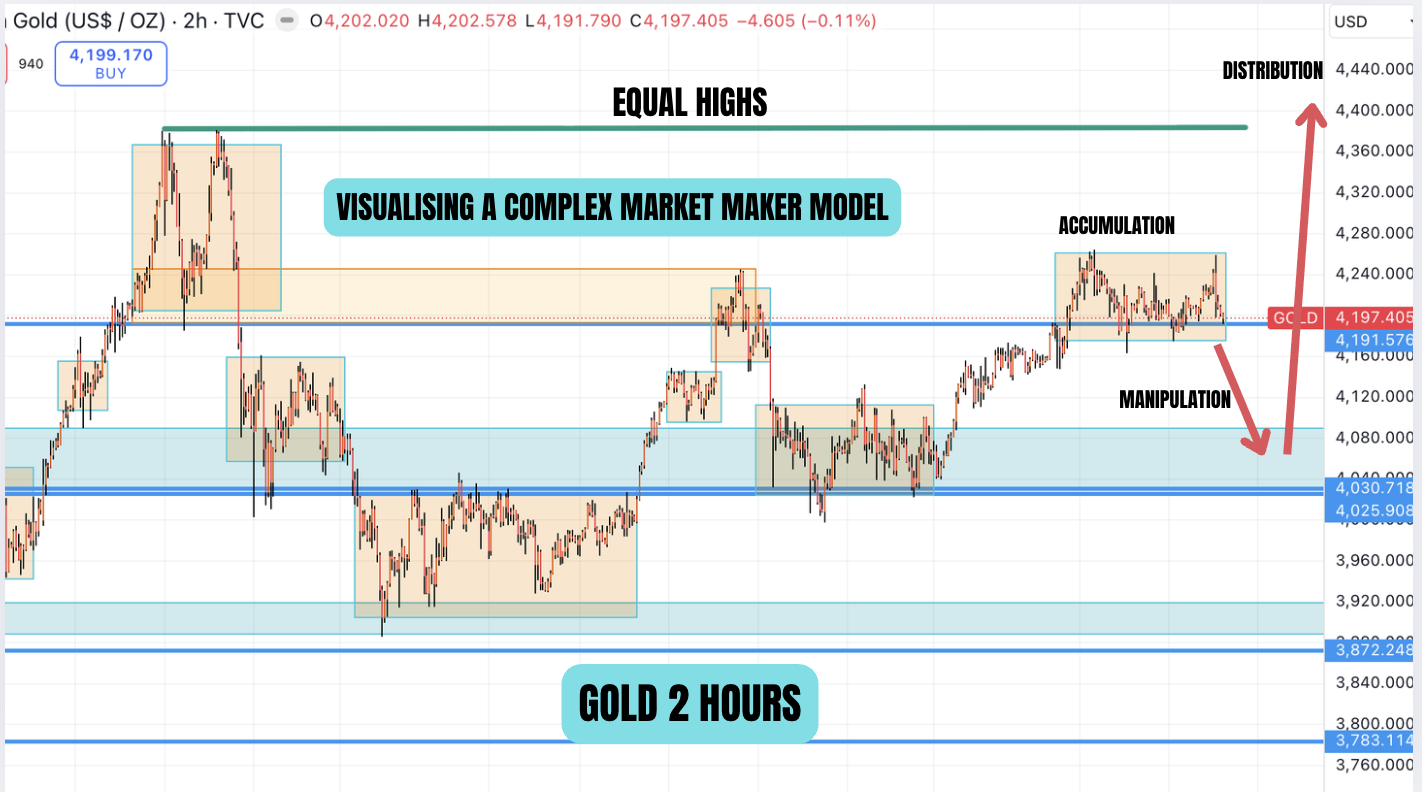
Coming back to our first chart, we are presenting a possible scenario for next week. The price has already accumulated in the resistance area and for a bullish scenario, the price would be manipulated down to our buyzone and then moved aggressively towards liquidity. This will satisfy the algorithmic concept oulined above. For aggressive moves price needs to take liquidity first. The above looks like a complex market maker model and the shaded areas are where orders have been accumulated.
If you look at this the lowest accumulation point here is $3920 area. If price stays within the current range next week, we will be looking for a raid of this area in the first quarter of 2026, before a move higher. This move would be very aggressive and similar to the move we saw earlier this year.
May the Lord God Bless you and Keep you.
Disclaimer: All of this are Muffett’s own views and is not investment advice. The sole intention of the blog is to showcase algorithmic price action and not investment advice.