USDJPY analysis -2/12/25:

First we present the 10 year yield chart of japan. This is the weekly chart. Between 2016 to 2020, the BOJ was implementing yield curve control and keeping the yields around 0%. However since 2021, they have started to normalize the rates. We have many posts on social media about the rise in the Japanese yields and how the carry trade will be impacted. Inspite of this and inspite of a massive rally in the japanese stock market (attracting interest from foreign buyers) if you see the USDJPY weekly chart we can clearly see that even as the yields of the 10 year was rising the Japanese yen was weakening against all currencies and it is very likely that the carry trade is alive and well.
Over the weekend, we have a narrative on the social media that Ueda will be open to raising rates in december. The USDJPY tanked and so did the indices. But we think that this is clearly manipulation. we will explain our thesis by presenting the USDJPY weekly chart. But first you have to be of the opinion that the market is totally controlled. The narrative is also controlled so the market makers can influence retail and institutional traders.
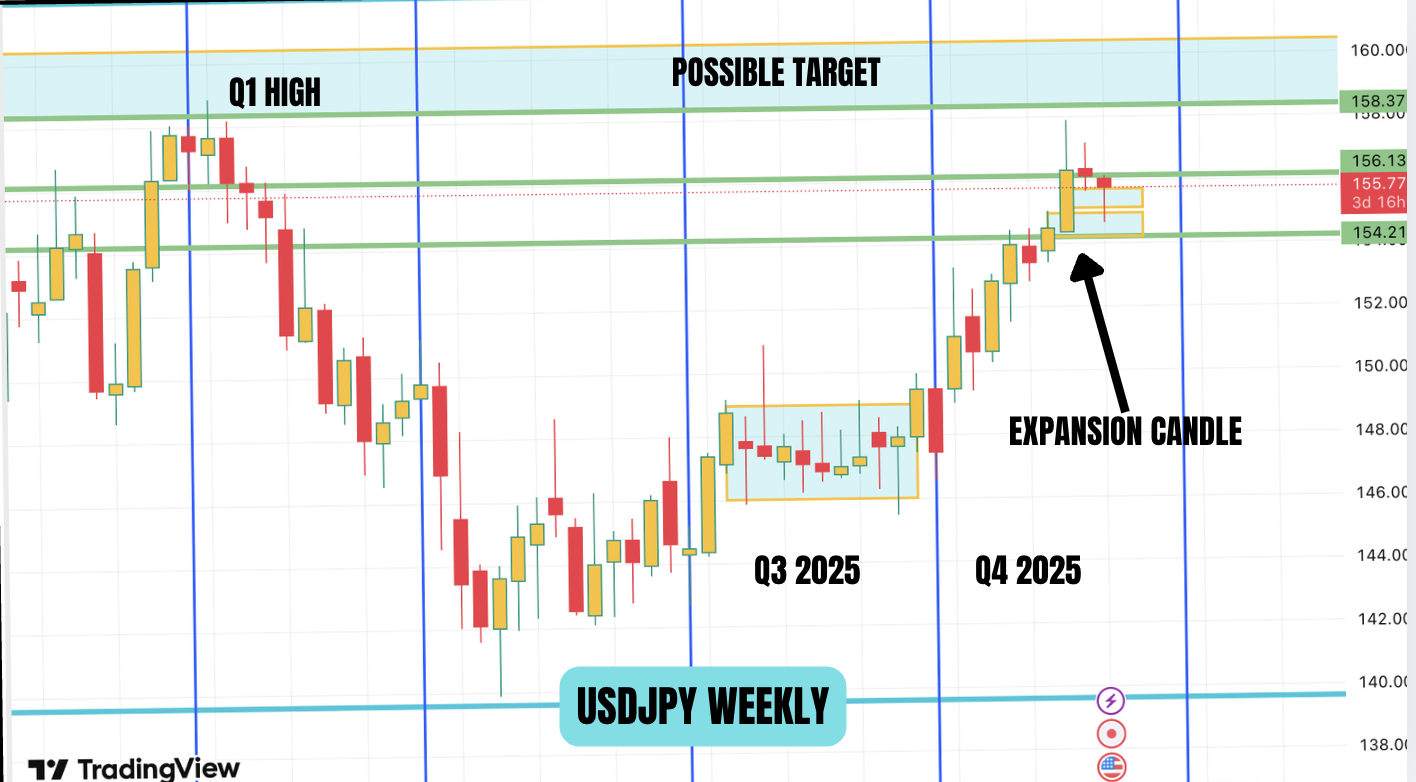
The above is the weekly chart of USDJPY. The price sold off from a Q1 2025 high to a low in Q2 2025 as the selloff in US stocks following liberation day unwinded some of the carry trades. However after consolidation in Q2, the price has started to expand. The price is now near the Q1 high. A lot of institutional investors who have hedges would have stops above the Q1 high. If the market makers want to take short positions on USDJPY, the easiest way to do this is to move the market above the Q1 high and this will trigger many stoplosses which will give enough liquidity for the market makers to assume the position. Now we are presenting a different narrative. The market makers are creating a narrative about the rising yields of japan. This induces many participants to take short positions. They have also moved the market (USDJPY) down and this induces more people to take short trades. With the Q1 high nearby, most of these shorts will have stoplosses above the high. This is engineering of liquidity by the market makers. It is important to remember this is just a premise that we are working on. We trade based on liquidity. So we think that there is a good chance that we can take out the Q1 high. If the price goes below yesterdays low on USDJPY, then this premise would be proven wrong.

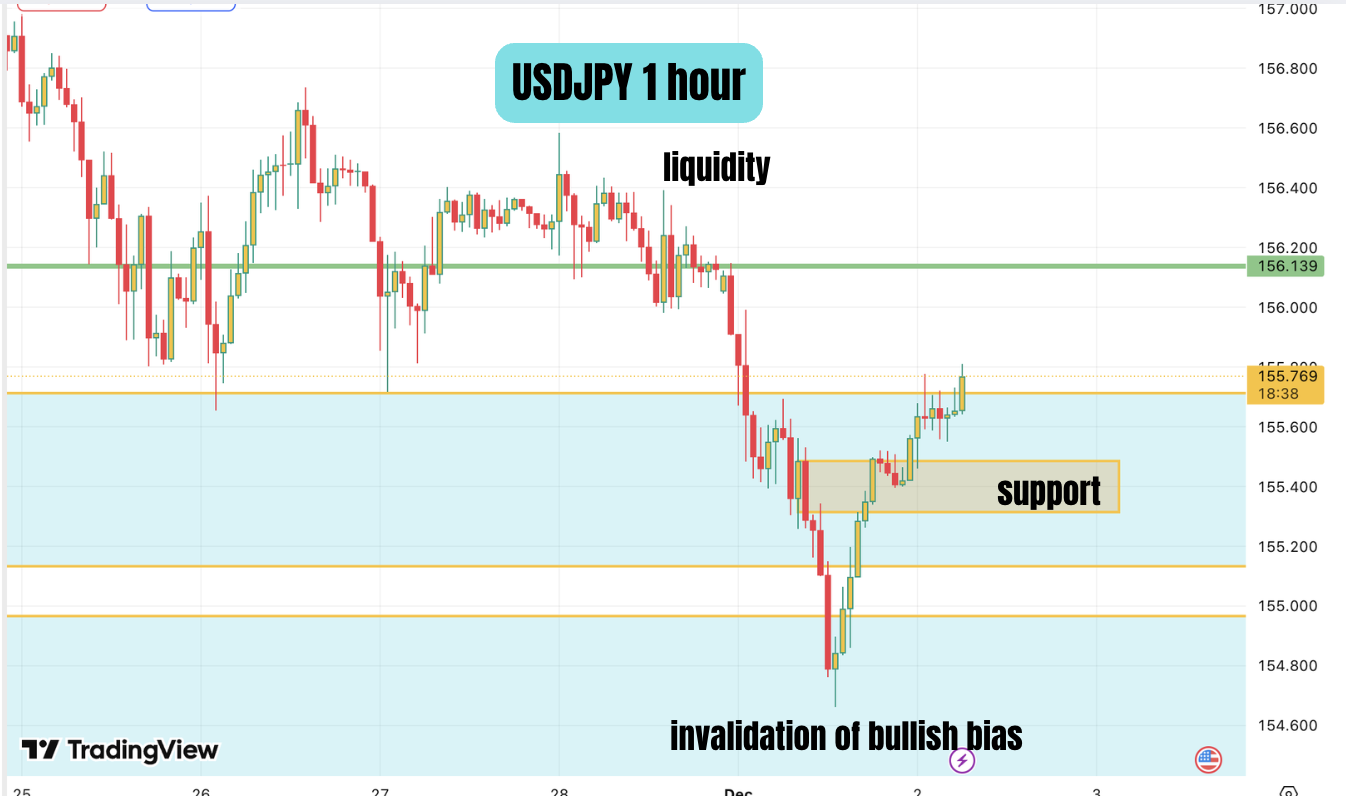
We are now presenting the USDJPY 4 hour chart and the 1 hour chart. We have previously shared the 4 hour chart. We had marked 2 zones of interest. The price came down to the lower zone before moving higher. The price as we write this blog is attempting to leave the zones. Once it leaves the zone, the price should not go back to the lows. If that happens then our premise and bias is wrong.
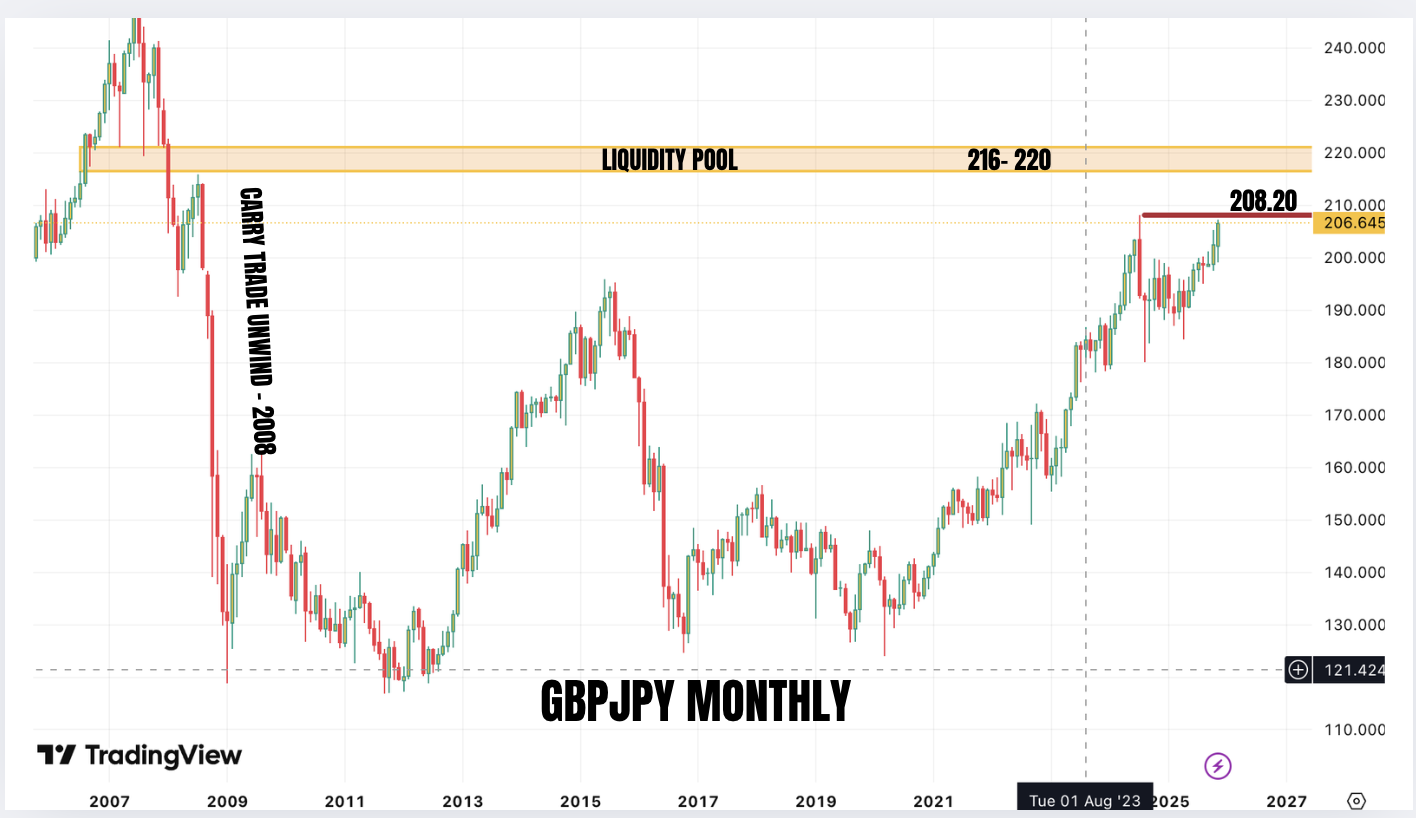

Now we are sharing the charts we shared over the weekend. You can see we have a recent high on the GBPJPY. The EURJPY already is at all time highs. So we have liquidity above on both USDJPY and GBPJY. To us they are easy targets. Also we have the yield differential between GBP and JPY. It is still substantial even with the rise in japanese yields. So we think that there is scope for both GBPJPY and USDJPY to rise further.
Once the liquidity above is taken, then we may turn bearish on USDJPY and GBPJPY. As presented in our weekly analysis, we might take shorts on GBPJPY as a hedge to the portfolio.
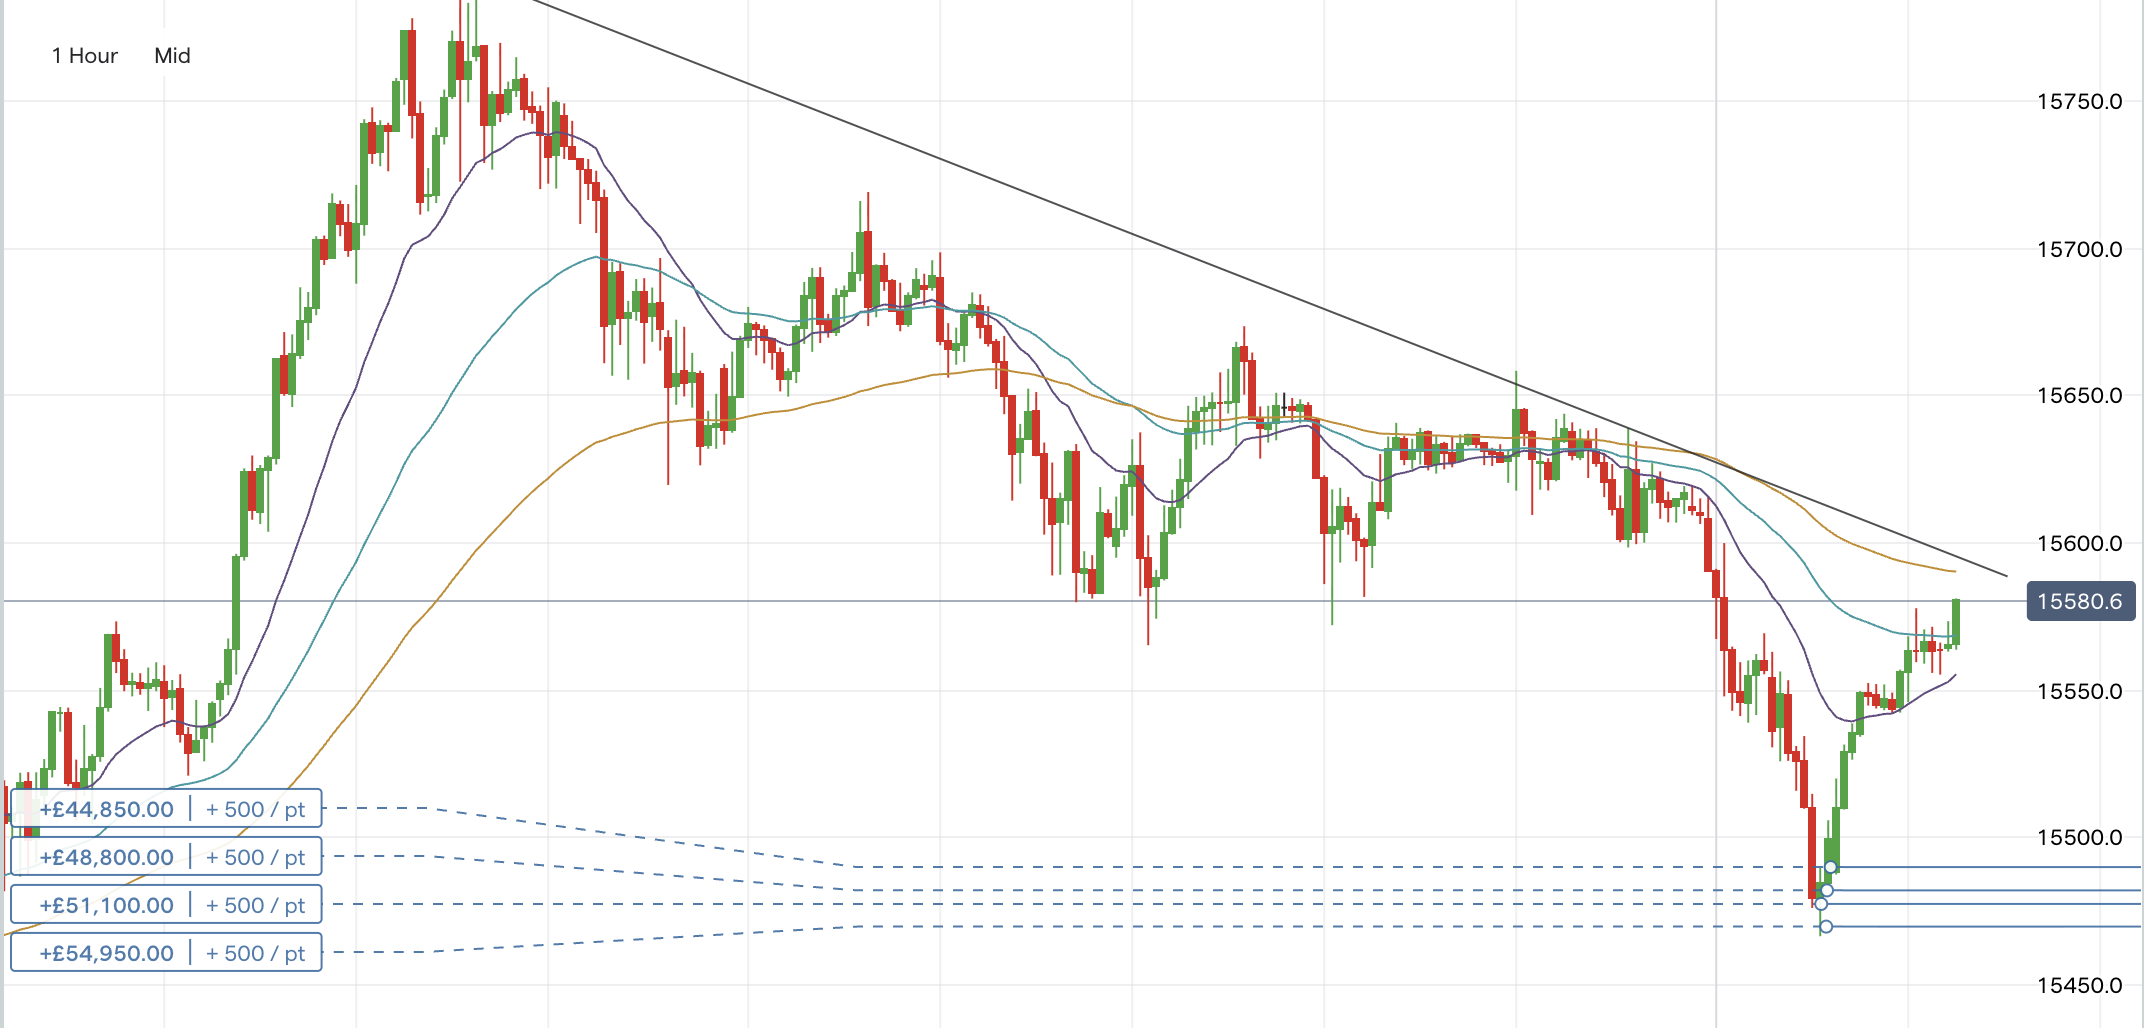
USDJPY entries. We called this out yesterday in our linkedin post. These analysis again is to showcase algorithmic techniques and for educational purposes and should not be construed as investment advice.
Disclaimer: All the blogs at Muffett investments are for educational purposes only and not investment advice.