Nasdaq analysis 11/01/2026:
Analysis by Muffett investments.
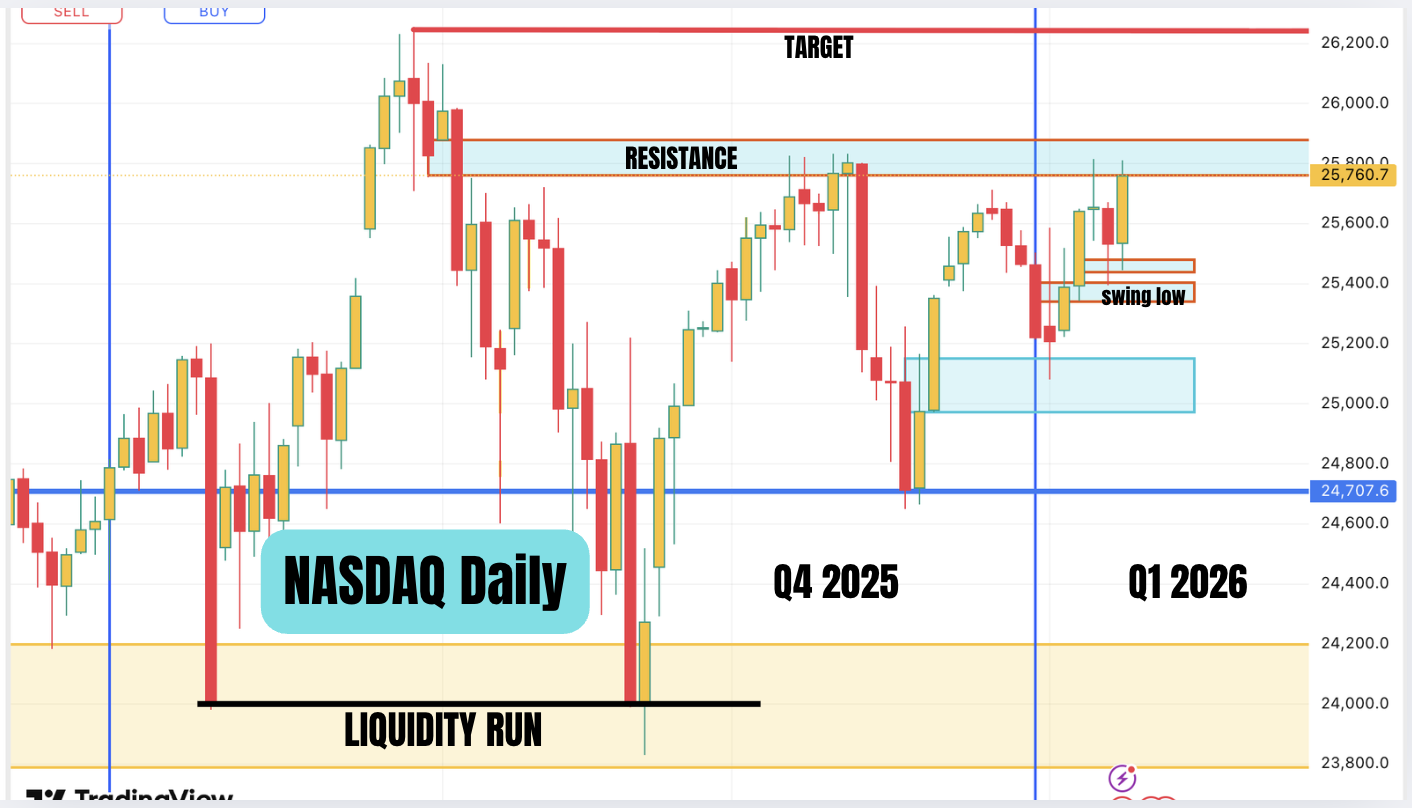
The above is the daily chart of Nasdaq From October to present. The last move lower would be considered as a liquidity run. The Price has rallied hard after this and then price tested the resistance zone and was rejected. Price then made a deep retracement followed by a run higher but stopping just before the resistance and turned lower. In our view ( we have a bullish bias at present) This is engineering of liquidity. The price moved lower and found support and has rallied higher and we have tested the resistance again after taking out the engineered liquidity.
It is not our job to look for tops and so we will maintain a bullish view for now. Price needs to move above resistance for it to go meaningfully higher. If the price goes below the last red candle marked swing low, then the bullish bias is invalidated. So we have a very clear roadmap for next week. We keep a bullish bias until the swing low gets broken. We have the CPI on Teusday and PPI on wednesday and the evolving iranian situation. Any escalation in the iranian situation can cause a market sell off. We suggest to raise cash so that we can deploy if we have a selloff.
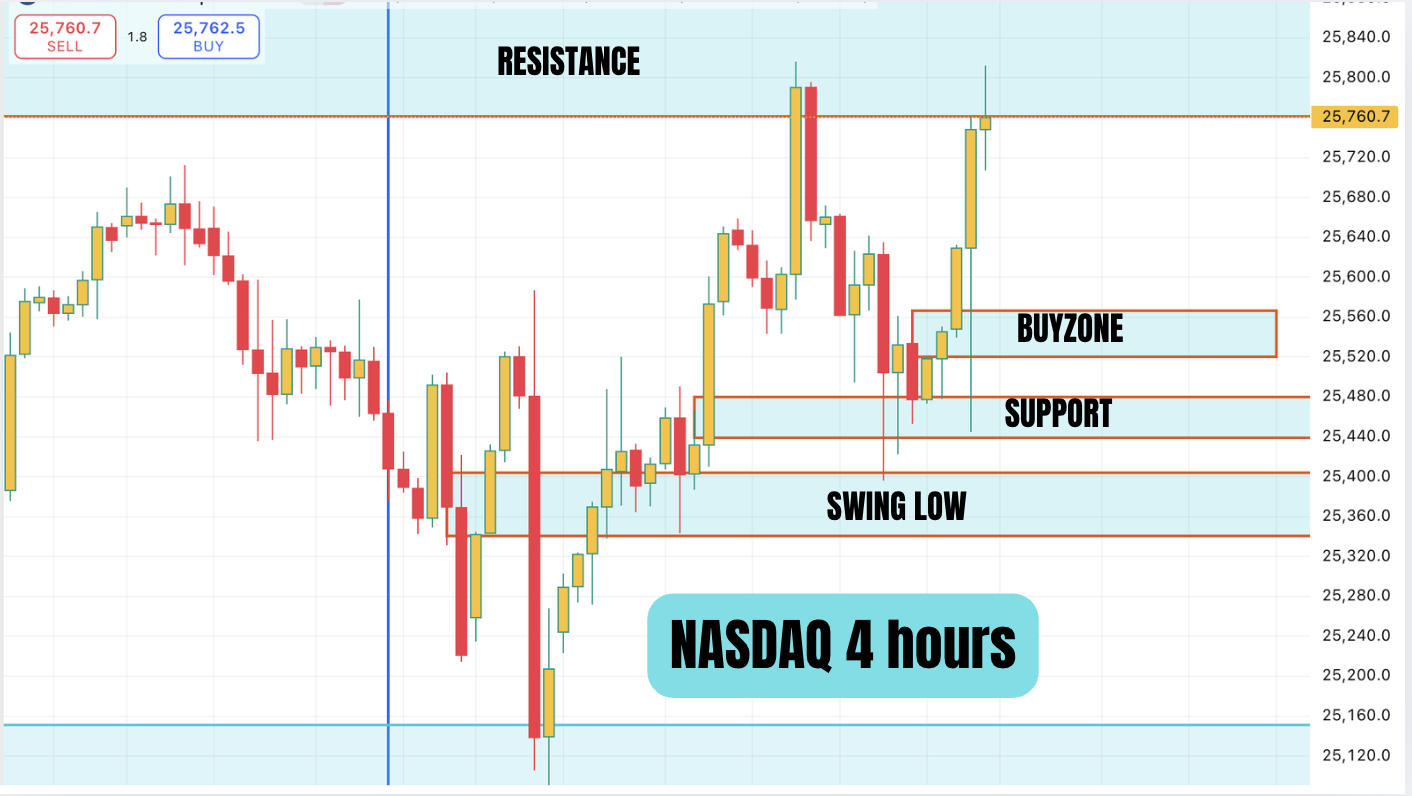
This is the 4 hour chart. If price goes above the resistance zone, then the zone becomes support. If price comes to the buyzone, then it gives us a low risk buy. If price closes below the support zone then the price is no longer bullish.
May the peace of the Lord be with you all.
Disclaimer: Analysis done in good faith and is for educational purposes only and not investment advice.