Is the DXY setting up for a massive rally?
Analysis by Muffett investments - 24/01/2026
First of all, we are not saying that we know everything. At best technical analysis can only give us a slight edge. And in fact we follow the same technical analysis like most analysts with a slight twist. We include the concept of liquidity into our analysis. We try to make predictions on the market makers intentions. We do not always get it right. But when we do, the edge is so good that we make up for all the losses and some.
The candle sticks are important and the market structure is important and so is liquidity. The liquidity could be sessional liquidity as in session highs and lows, daily highs and lows, weekly highs and lows and quarterly highs and lows. Every once in a while the market makers move the market against the trend - Manipulation and it is our job to recognise manipulation. So we identify the higher time frame trend- The market maker intentions and when manipulation happens we enter alongside the market makers.
Another market maker playbook is the Accumulation, manipulation and distribution -AMD pattern. Again we can see this in all timeframes. And we think that this pattern is forming on DXY on the monthly and weekly timeframe. In this pattern, the market is held in consolidation and the positions accumulated. Then there is a false move on one side to attract the market participants and get them on the wrong side. The price is then aggressively moved in the opposite direction to take out the liquidity. Let us lay out our thesis as to why this is happening on DXY and then you can then make informed decisions on your investment.
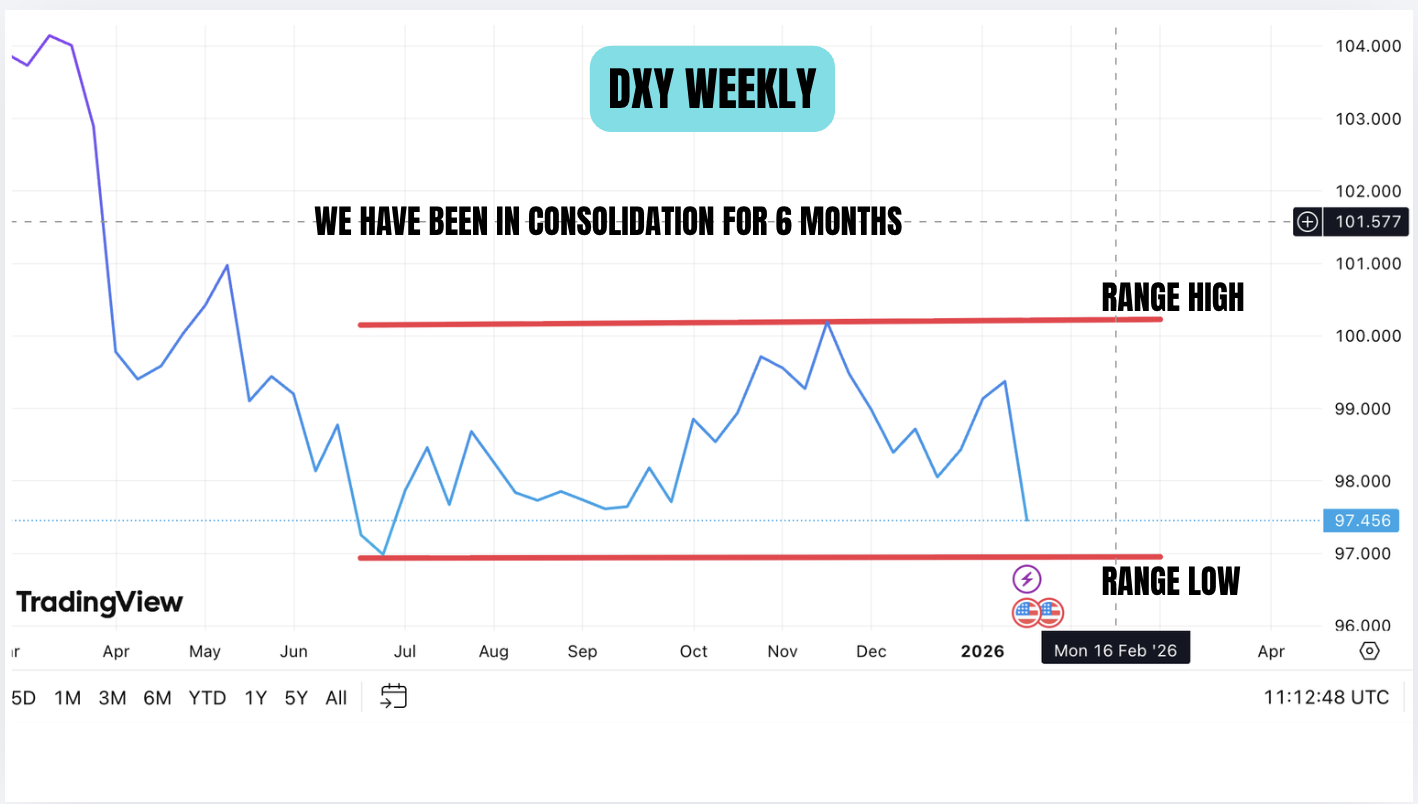
The above is the weekly chart of DXY. In the forex world it looks like the DXY is falling for ever but infact we have been in a broad consolidation from the middle of May. When price is in consolidation, it can continue in consolidation or break out. Currently we are in the lower range of consolidation. If we have a breakout we usually will have manipulation first before the breakout. So we can argue that if price were to break lower, then a measure of manipulation should take place. We can argue that this has already taken place when price moved higher in the first few weeks of January and took out December high.
At the same time we can also argue that price is being manipulated lower for a move higher. So far we have done a very non biased analysis of current DXY price action. However there are certain divergences on the charts which make us think that we should start looking for DXY longs until these divergences are invalidated.
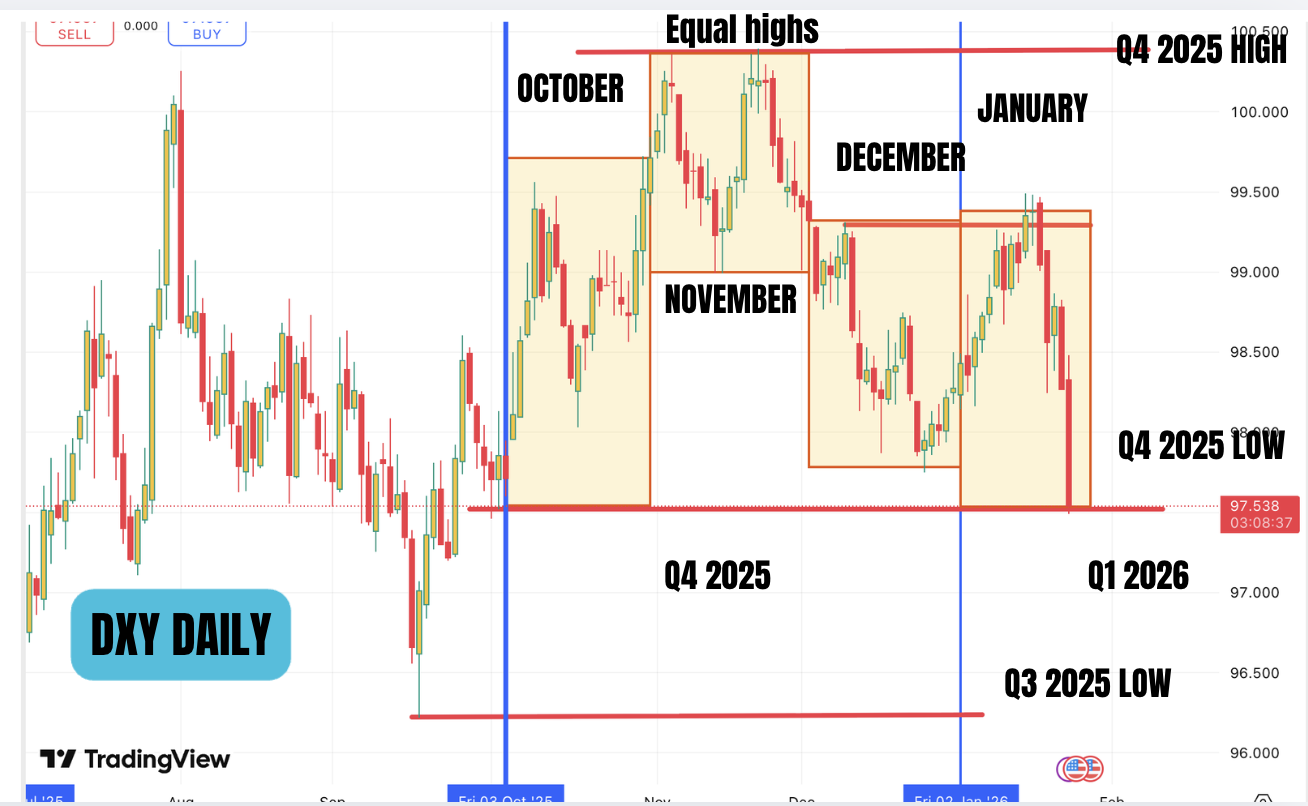
The above chart is the DXY daily chart. The vertical lines represent each quarter and we have marked the Quarterly highs and lows. Also we have each of the months of Q4 2025 shaded. At the around the middle of the last quarter equal highs were made. Although the second high made a slightly higher high, it was so shallow and we think that there is a good chance that this Equal highs are going to be the target in the first half of this year, provided certain conditions are met.
In the past we had been calling for a raid of the Q3 low followed by a move higher. We even took shorts on GBPUSD and EURUSD but we were stopped out. As you can see now, the price moved above December high and then moved lower aggressively. The move higher has taken early shorts out ( market makers stopping out the shorts) followed by a move lower and this time the market makers have taken out the longs. This is called double purge. This usually sets up for a aggressive moves. There is a chance that this move could be a move lower. But based on our premise that the Trump administration would want a stronger dollar going into the midterm elections and also considering the geopolitical situation, this is less likely. Also the divergences which we will show below tilts the favour to the long side.
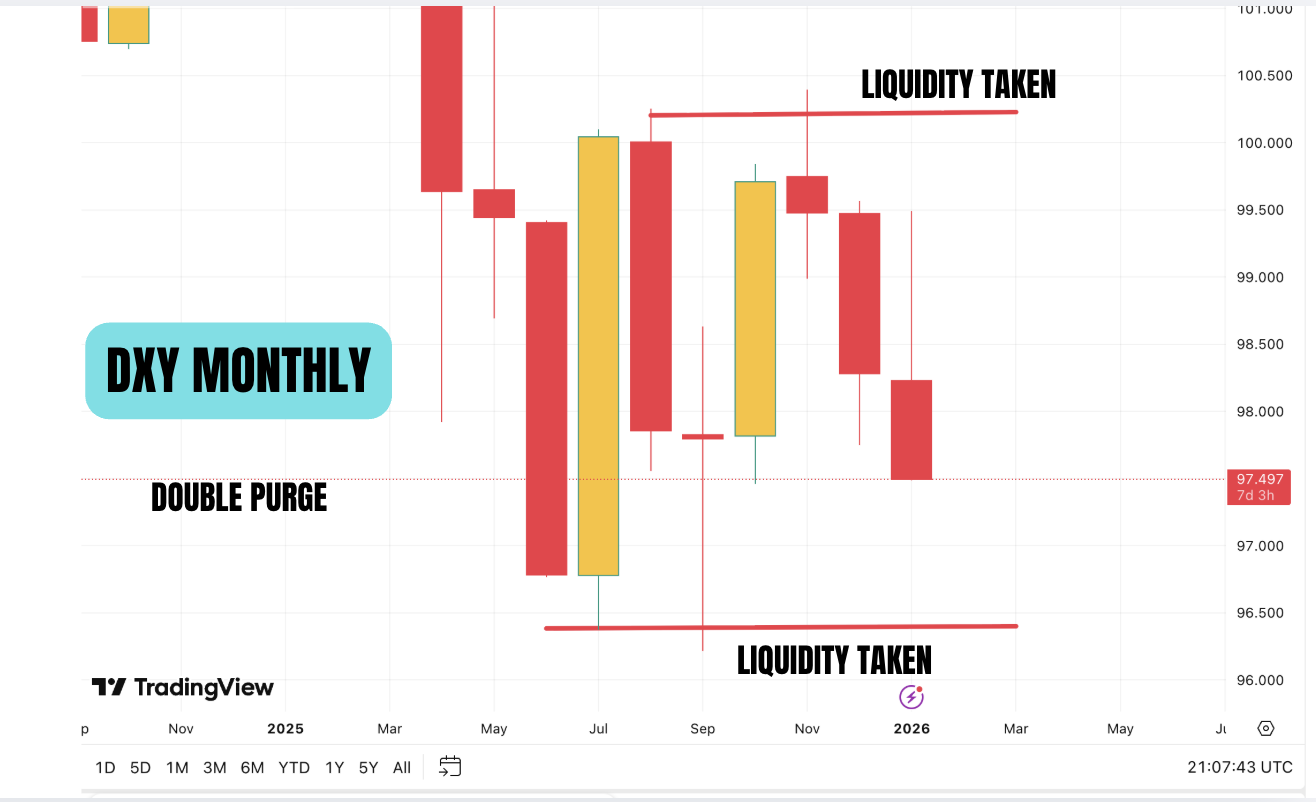
Before we show the divergence, we want to show the monthly chart to illustrate the double purge. The price moved aggressively down in May and then in July we have a bullish engulfing candle. Price then moves down and takes out the liquidity of this Bullish engulfing candle. At the lows, there was divergence between DXY and EURUSD. The price then moved aggressively higher and took out the Highs. At the highs, we had divergence again between DXY and EURUSD. The price has now moved lower with an aggressive move lower.This is the Double Purge. As this was happening, we can see divergences between EURUSD and DXY on the weekly timeframe. The EURUSD chart shows a higher high and the DXY shows a higher low. This is crucial in deciding the next move. However as we have suggested in the past, divergences alone are not enough. We need price action to confirm the divergence and so from next week onwards we will looking for price action to suggest a move higher in the DXY. If this does not happen, then we will wait for further confirmation. If however we see price action that suggest a bullish DXY, then we will take shorts on EURUSD and GBPUSD.
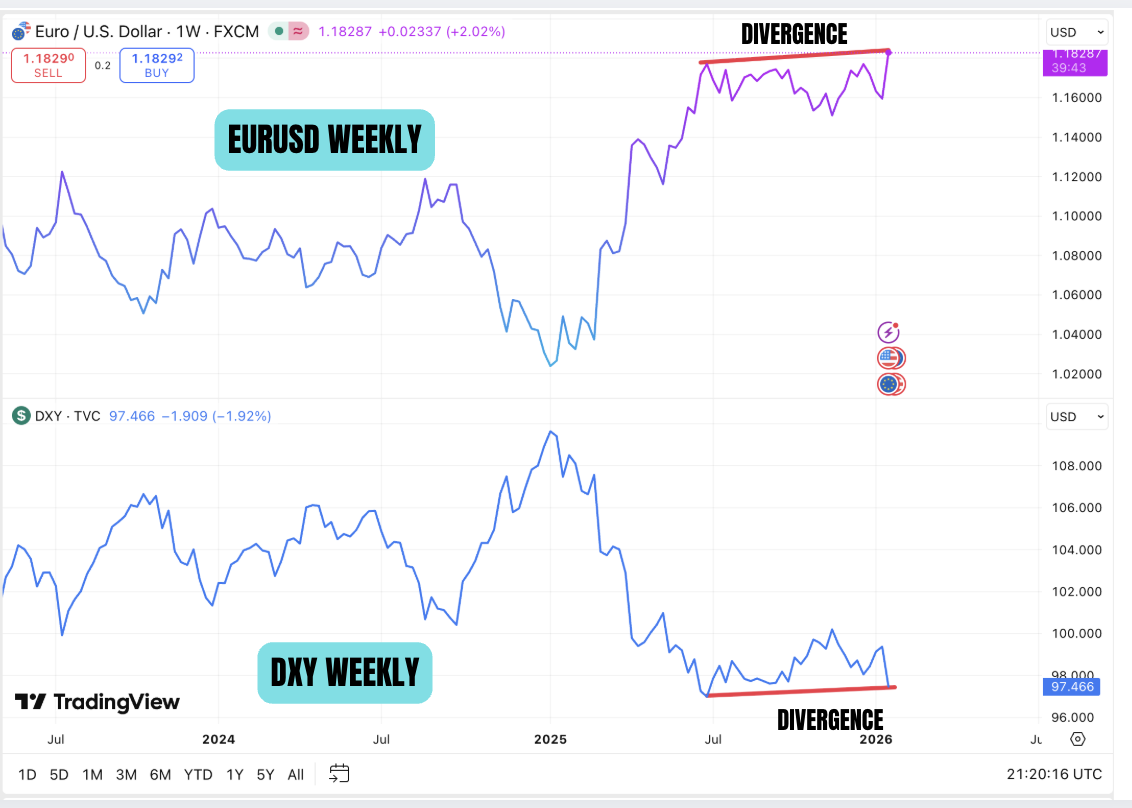
chart above shows the divergence.
We have always argued that the devaluation. in the dollar that most people are expecting will happen in terms of gold, silver and commodities. The overall devaluation against other currencies will only be gradual and minimal. The maximum move that we can expect would be DXY 90 but we think that unless the divergence are invalidated, this will happen after the midterm election and not before. As always we will let the price action guide our actions.
A separate analysis on USDJPY will follow tomorrow.
May the peace of the Lord be with you always.
Disclaimer: This blog is for educational purposes only and is to showcase algorithmic techniques and not investment advic.e