Nasdaq analysis 01/02/2026:
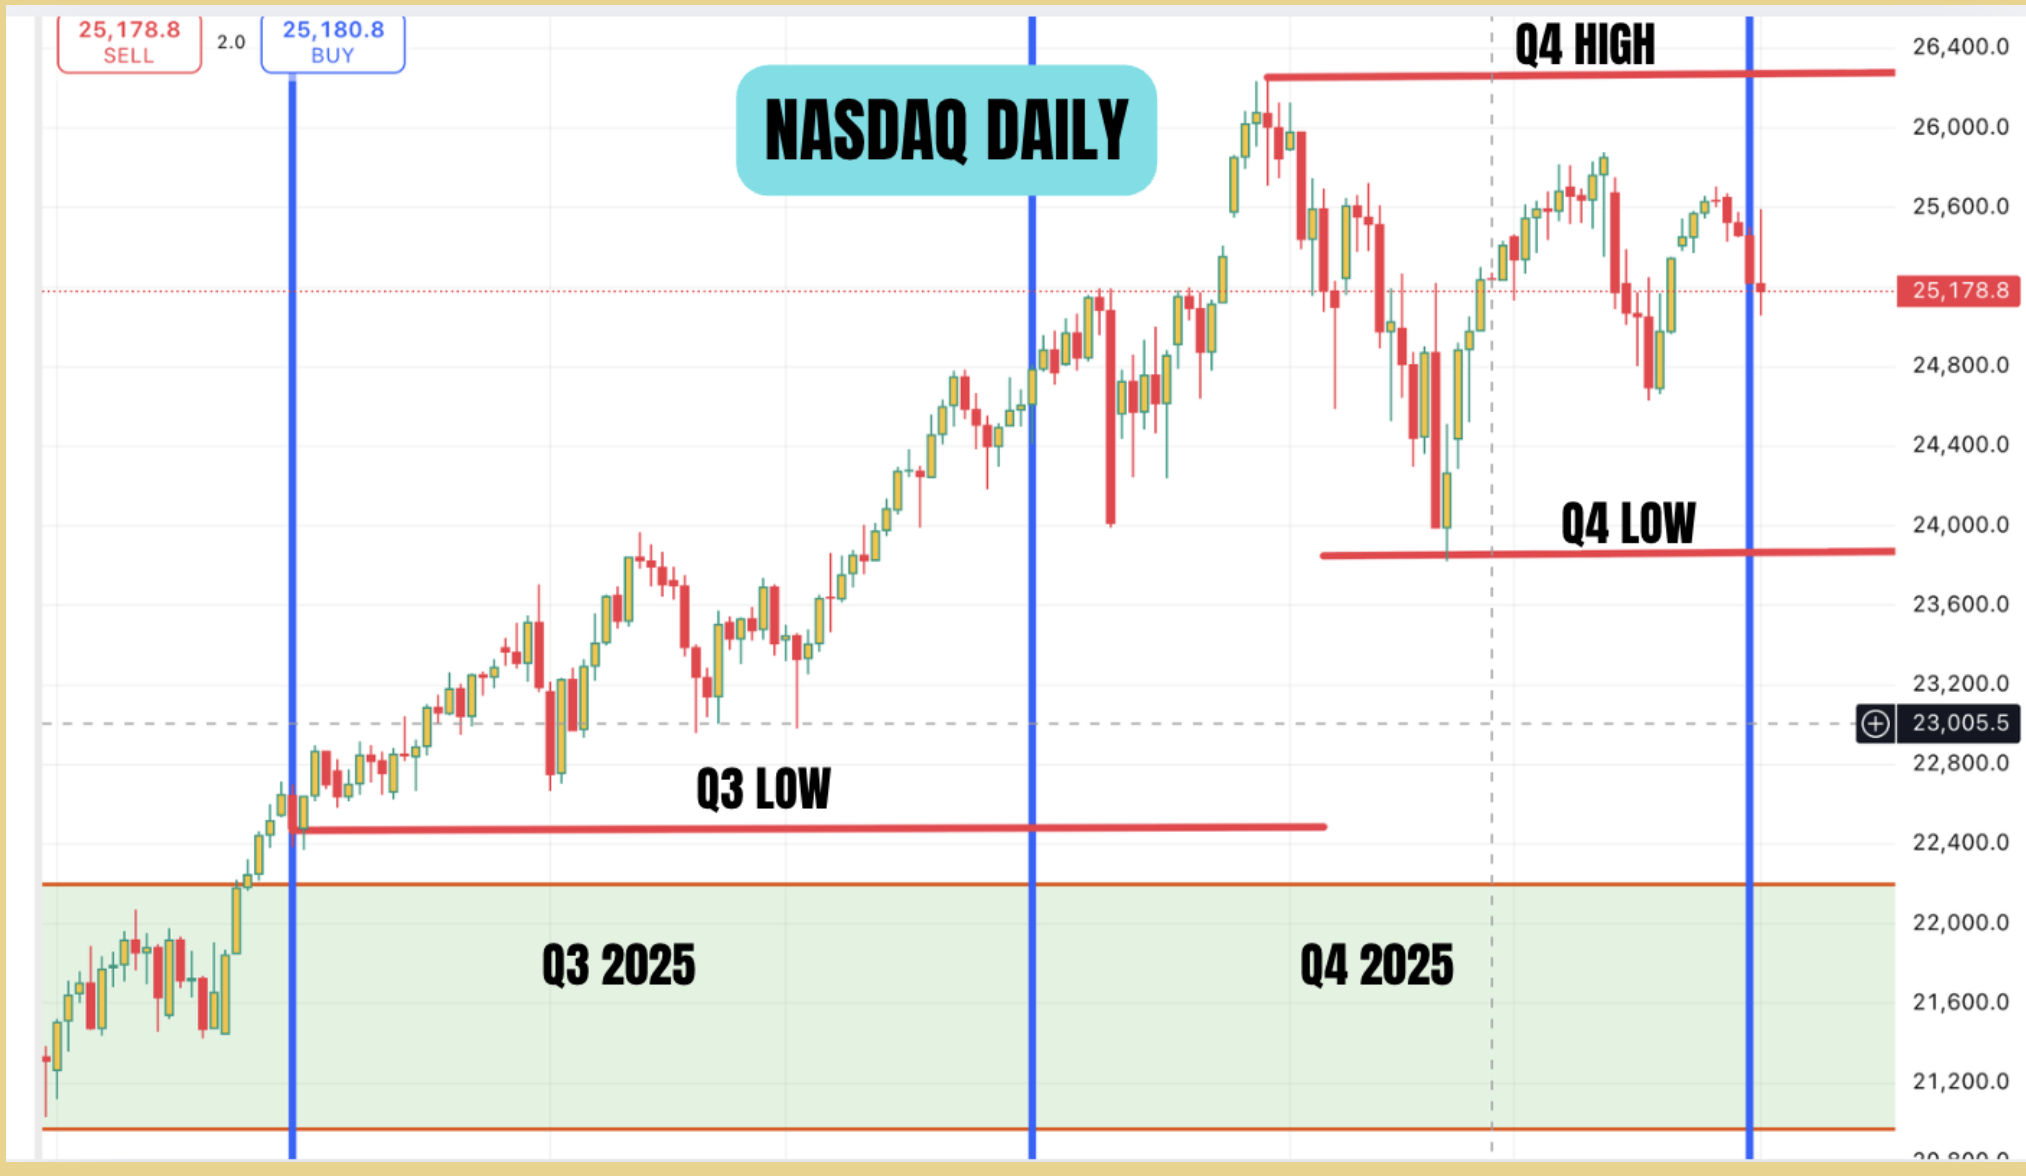
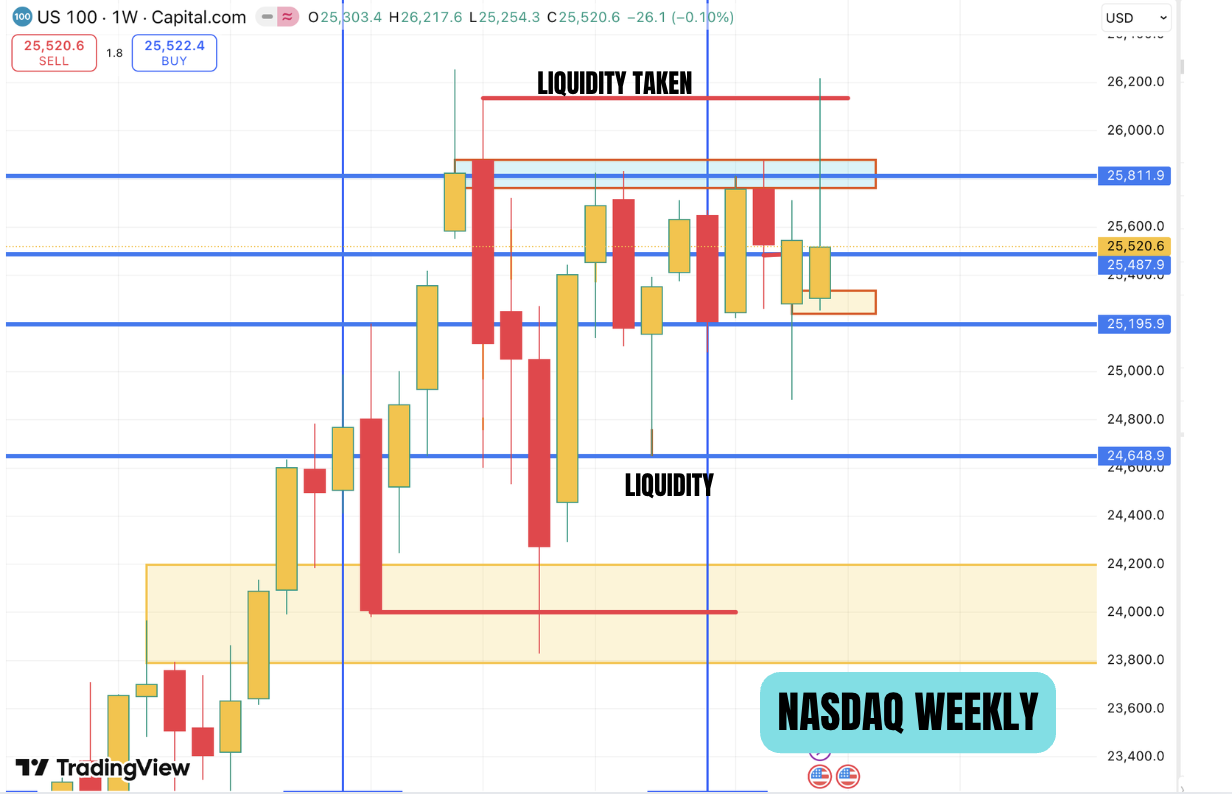
This was our analysis done at the beginning of the year. We were expecting a Q4 low to be taken before a move up. But price took short term liquidity and moved up to the top of the range. It has however not taken the Q4 highs. At the same time if you see the S&P 500 chart, you can see that it took the Q4 highs. So we have a divergence between the two indices. Now our focus should be the Q4 low or atleast the january low. See the current weekly chart to see the price action below. The blue shaded zone is current resistance. The price moved up the zone and above it and took a short term liquidity and then close under the resistance. This price action in our view is bearish. So as long as the price is below the blue resistance zone, we will be looking for shorts. This price action is typical of january as the market makers accumulate the positions in a tight consolidation.
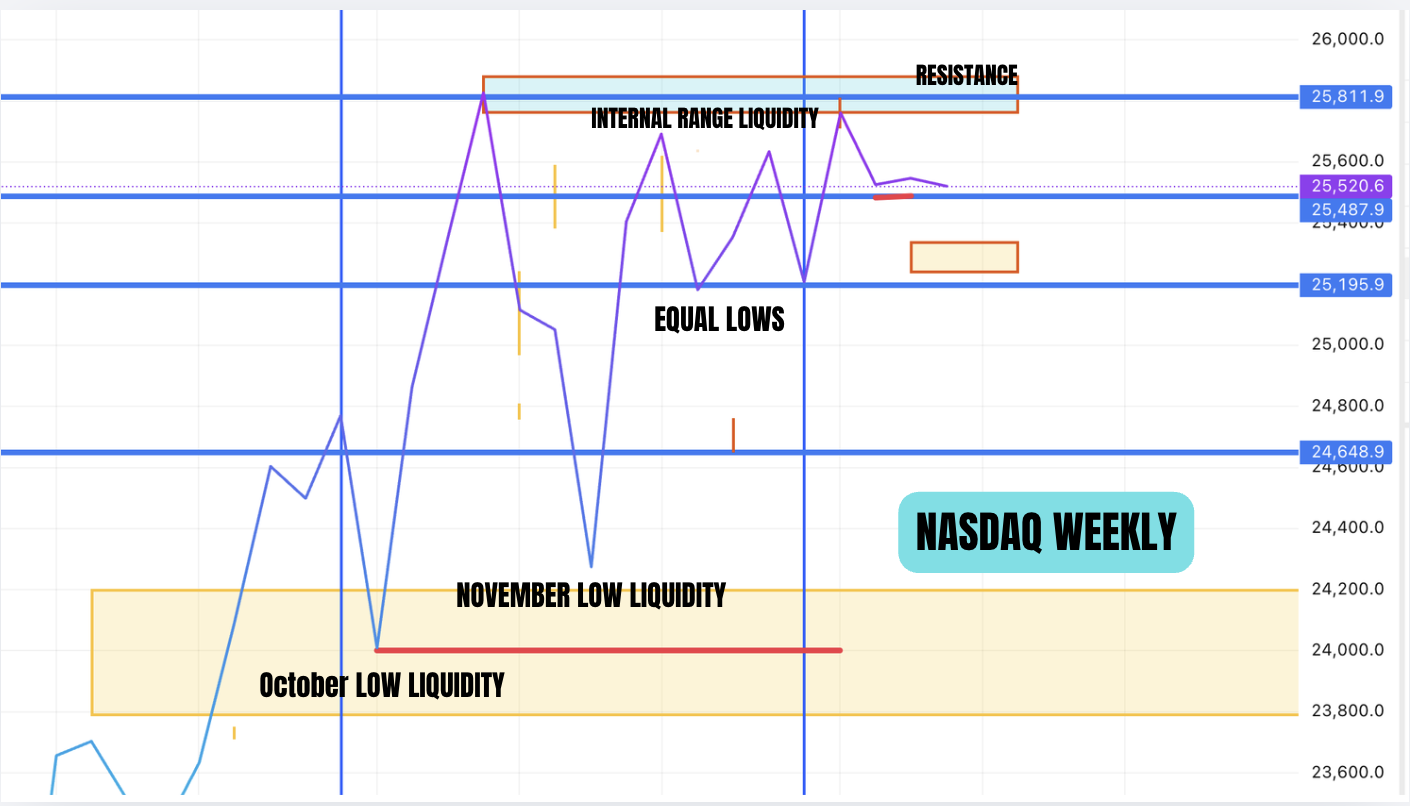
The line chart will illustrate the price action better. We have not moved around the consolidation since decemebr 2025. As you can see there was a relative equal lows and relative equal highs. The price has now taken the relative equal highs and this would be considered as internal range liquidity as the price has not takne the highs. And we are in tight consolidation for the last 2 weeks as the line chart shows flat action but price has moved up and down on the candle stick chart.
As we base our analysis based on liquidity , we can expect the price to to go down to the opposity liquidity. The first target would be the equal lows and then depending on market action, the january lows which is at 24, 648 and november lows. We wont know how low it goes but we have to watch the price action and look for reversal once the liquidity is taken.
Our expectations before the November midterm election is that price would be higher than the current lows made in the first quarter. We do not know the exact lows but for price to move explosively higher, first liquidity needs to be taken first. That is a core concept of algoirthmic trading.
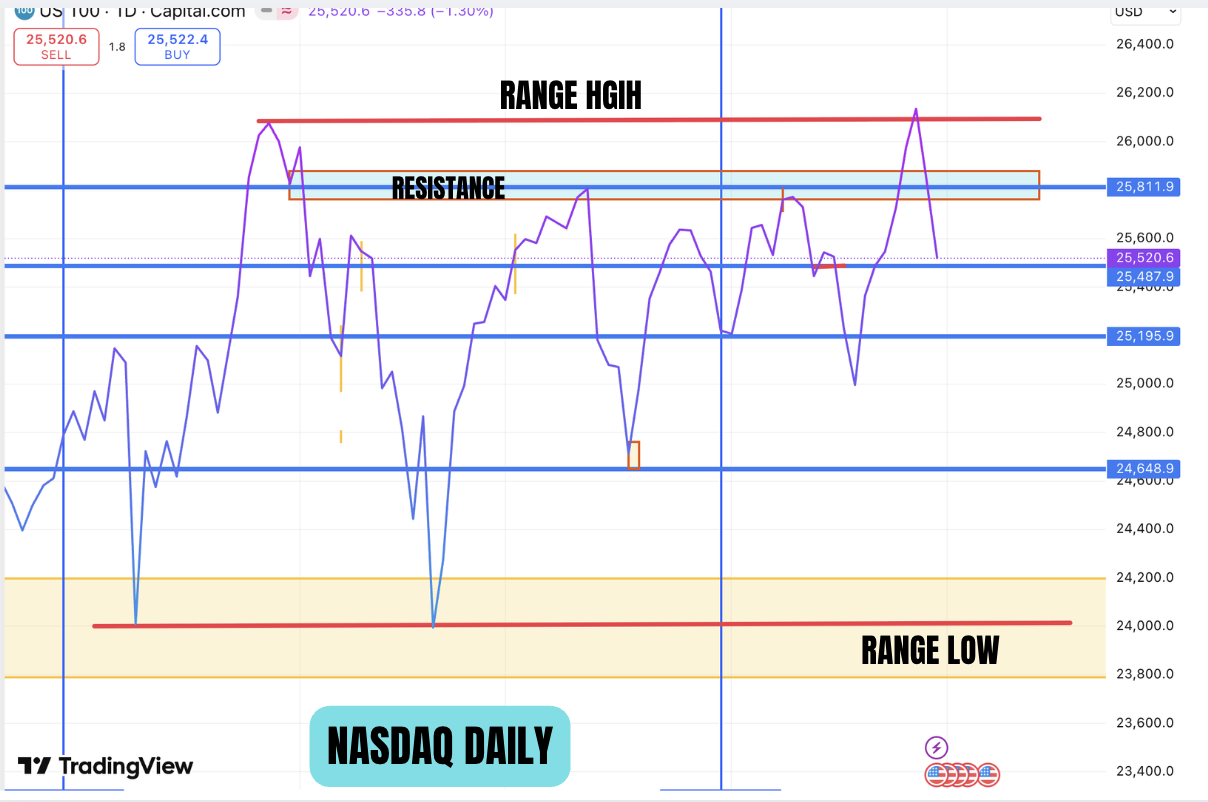
A view of the current trading range on a daily time frame. It is important to realise that the current scenario is only valid as long as price is below the resistance zone. IF price goes above the resistance zone, then the analysis will be invalidated.
The above blog is for educational purposes only and done in good faith. These are our own views and not investment advice.
May the peace of the Lord be with you always.