GOLD analysis - 02/01/2026
As we start the New Year, we have to first remind ourselves on the fundamental thesis on a gold bull market. The governments in our view will have to keep printing to prevent the stock market bubbly and housing bubble from popping. Most of the growth in G7 countries particularly in countries like UK has come from increases in asset prices which gives an illusion of wealth and the governments are using this asset price bubbles to tax the population more. So although we have had a great run last year, in our view there is more rallies to come. We may not see impressive rallies like the ones we saw last year. But it is also possible. Our target for gold is still $10,000 by July 2026. This looks increasingly unlikely but in the current geopolitical climate anything is possible. As the Trump government faces mid term elections, at Muffett investments we are expecting increasing risk of geopolitical escalation and in particular trade war with China. so we think that we will have much higher volatility similar to the time we saw around the Liberation day tariffs. For a fundamental analysis on gold, please see our previous blogs on this.
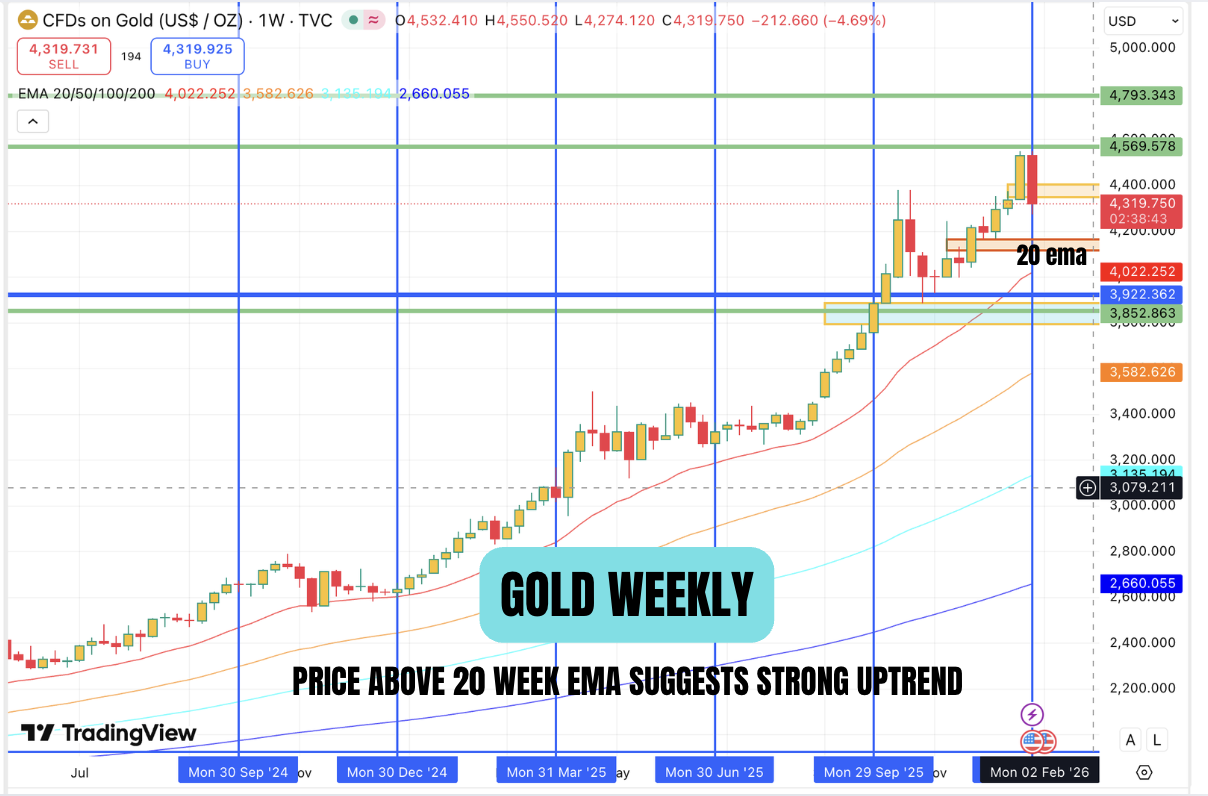
The above chart shows the weekly chart of gold. The price is currently above all the moving averages and the price is well above the 20 week ema. We think that if we have a retracement to the 20 week EMA, it would present a low risk entry to gold with risk management stops. As gold will see much higher volatility, we suggest just exposure to gold miners and silver miners with exposure to gold. The blue vertical lines indicate each quarter and we have not had a liquidity run ( run on stops) at a quarter level for quite some time. Infact, we have not taken out a monthly low in gold in quite a few months since it broke out.
So in Q1 2026, we are expecting atleast a liquidity run on the monthly low ( December’s Low). Please see the daily chart now.
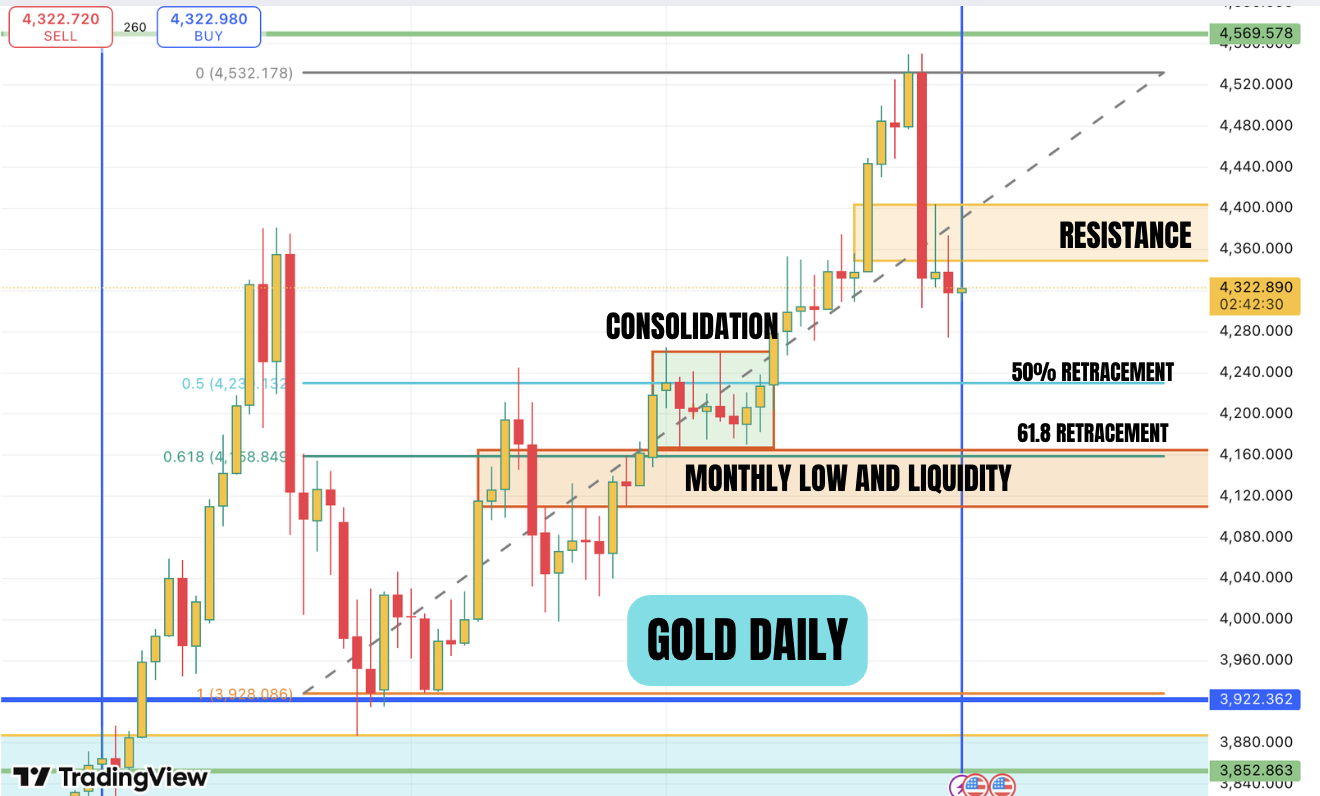
The above is the daily chart of gold. There is a chance that the current price action could be a market maker sell model . Here there is a consolidation which is marked followed by a rally higher and once the liquidity at the top is taken, the price is taken lower below the consolidation. So this is the current scenario that we are working. The orange box below the consolidation is a monthly low and a monthly liquidity pool. A retracement to this zone could be used to accumulate positions for a move higher. If we lose the orange box, then price can retrace all the way to the blue box which would be a quarterly low. We have to assess price action in gold at the time when price tests the monthly liquidity pool.
Also if we draw a fibonacci retracement on this current move higher, we can see that the 61.8% retracement is just above the monthly low. The first few days action should be ignored as the market makers move the market up and down to accumulate positions. So only short term positions should be entered until a clear move can be seen on the charts.
We prefer gold miners as a focus compared to gold. Our favorites are still Newmont mining, Hecla mining, Hudsbay minerals and Alamos gold. In our view, if you want silver miners exposure, concentrate on names which have both silver and gold exposure.
May the peace of the Lord be with you all.
Disclaimer: The above blog is Muffett’s own view and is for educational purposes only and does not constitute investment advice.