DXY and USDJPY analysis- 01/01/2026
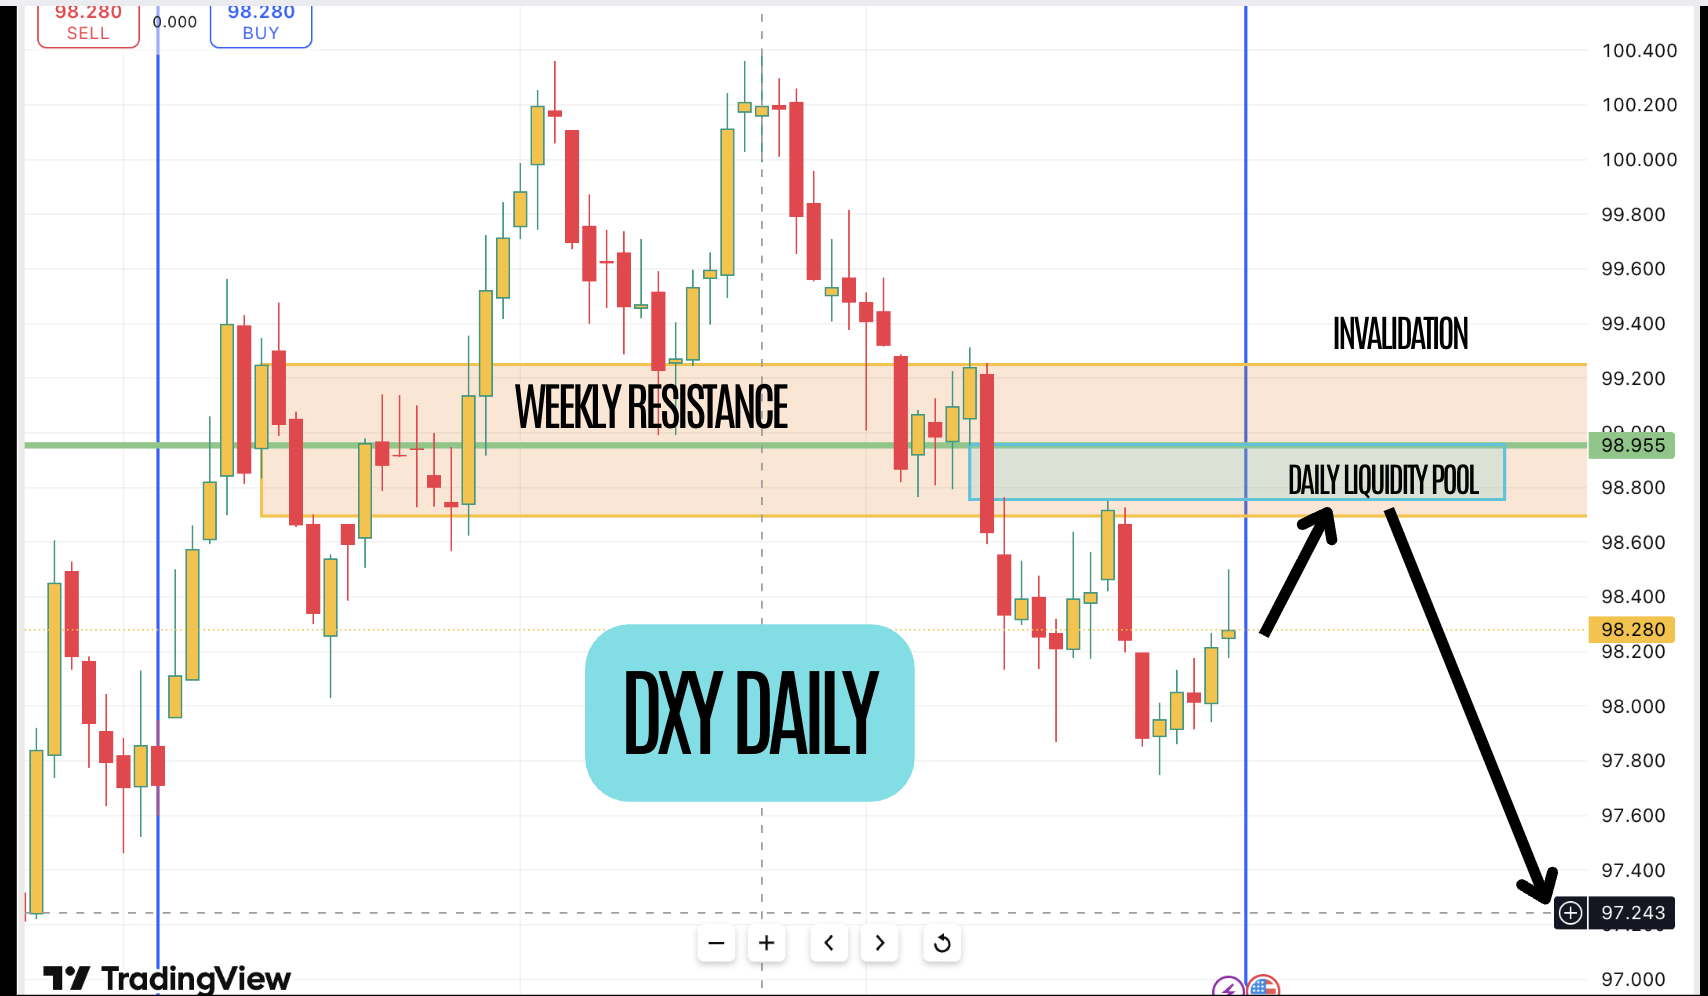
Please see previous analysis. We had the weekly resistance drawn out. We were bearish on DXY going into the next quarter. We maintain our views on that. The market makers have engineered a negative sentiment on the Dollar and everyone is talking about how the dollar could fall substantially. In our view, that is what the market makers want. To engineer the sentiment among market participants so they can take the opposite positions. Consider for example how the silver top was formed. There was extreme euphoria engineered prior to the top. The same thing happened with gold. There were many posts on linkedin including Muffett’s on the bullishness of gold. The idea here is that the market moves against general market sentiment.
Yesterday we noticed something we had missed before. There is a daily liquidity pool which has formed within the weekly resistance area. We think that the price will go there to upset the DXY bears and engineer short term DXY bullish sentiment. We also think that at the same time USDJPY will take out the Q2 2025 that we have been expecting( analysis will follow here ).
So going into next week we will be watching if the DXY can go into the daily liquidity pool which is residing in the weekly resistance. Once this happens we will be looking for shorts on DXY- Mainly Longs on GBPUSD and EURUSD. If price closes above the weekly resistance, then our premise is wrong and we will become bullish on DXY. This is our current Expectations/ Predictions for 2026.
USDJPY analysis:
Before we look at the chart, we shall look at some context
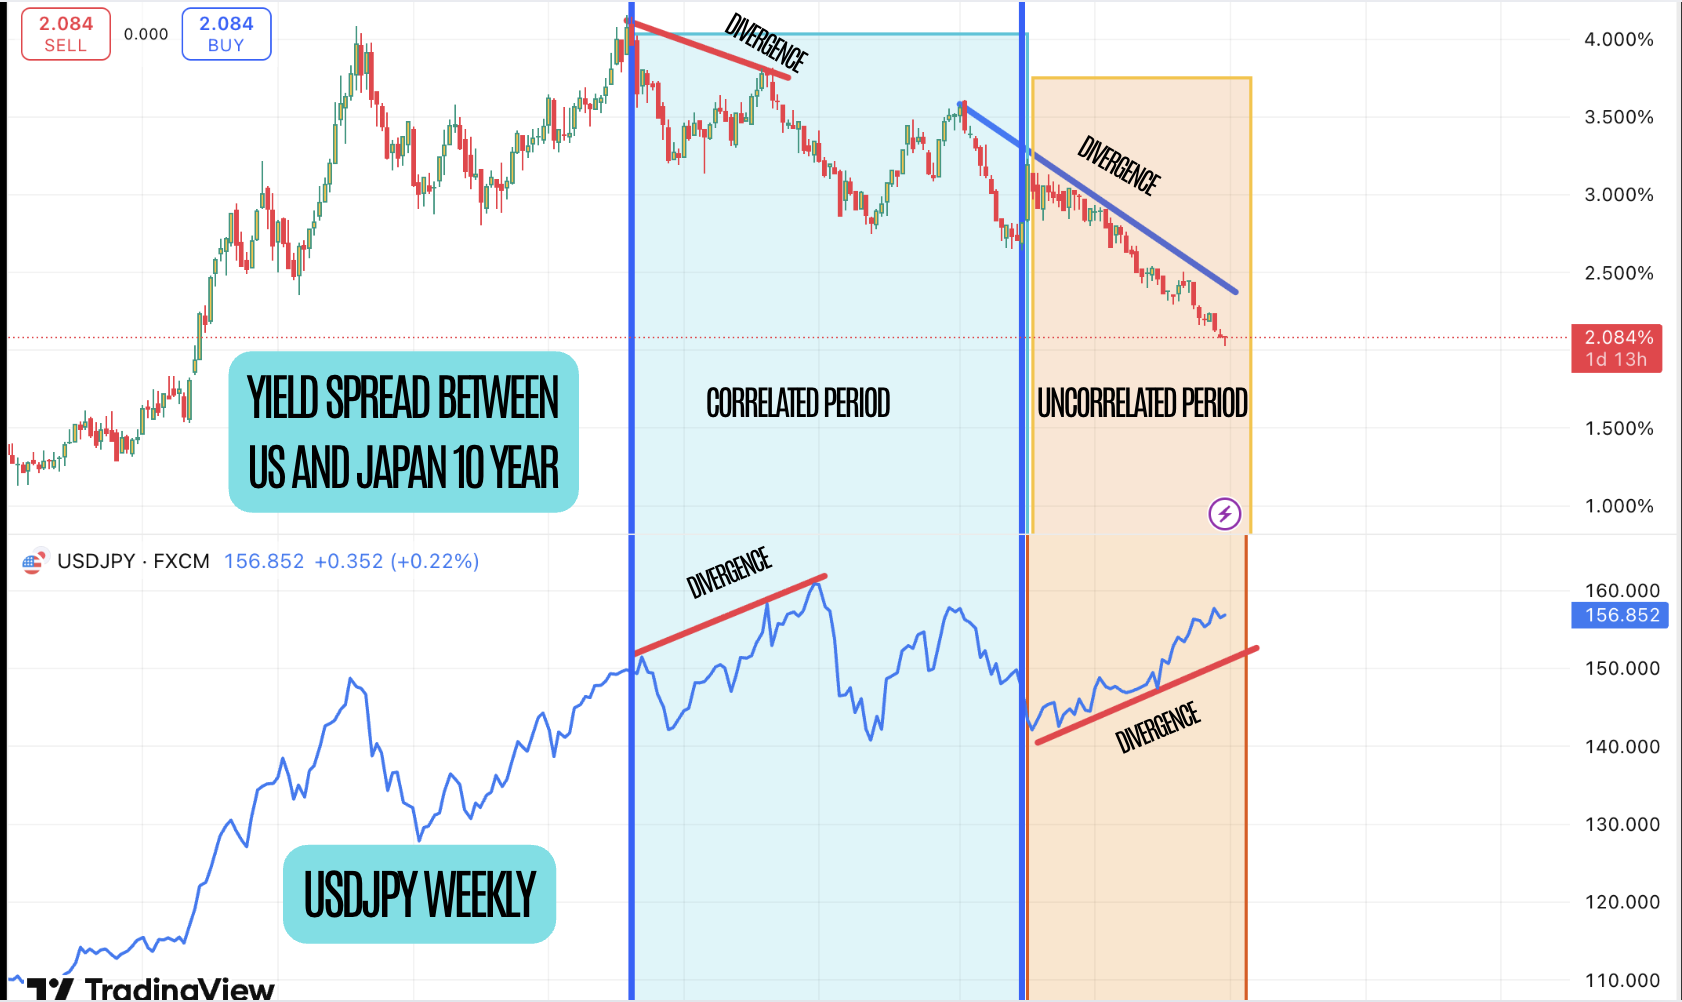
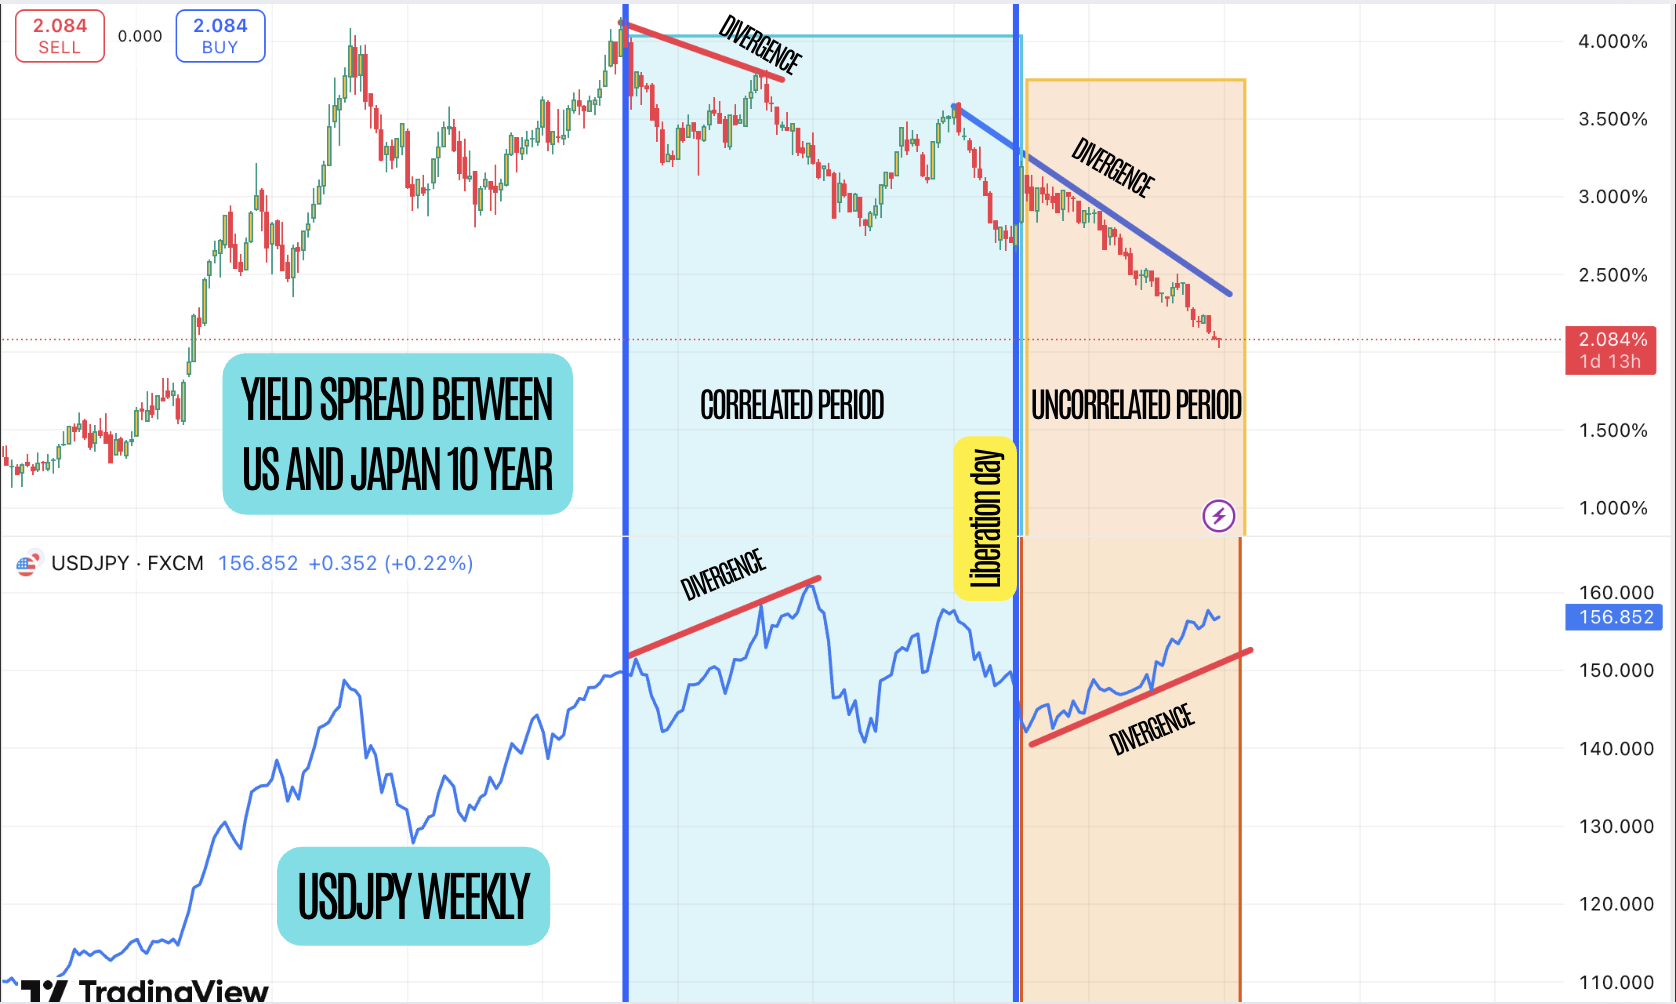
The above chart shows the yield difference between the US and Japanes yields. This is the fuel for carry trades. In general the USDJPY pair follows the yield spread. But it is not 1 to 1 correlation. There can be periods where this could be uncorrelated and we can see divergences. The blue shaded area shows are period of correlation with divergence ( yield spread makes a lower high and USDJPY makes a higher high) from oct 2023 to March 31 2025. Then Liberation day happens. And the orange shaded area shows the uncorrelated period where the USDJPY has continued to rise even though the yield spread is falling. It makes one wonder whether the Liberation day has something to do with this. The main point here is that there is no 1 to 1 correlation. If you were to trade USDJPY based solely on the yield spread, you would have been shorting USDJPY from April this year while USDJPY rose from 140 to 156.
It does not mean that we should not take into account the falling yield spread. What we are looking for now is when this uncorrelated period ends and price starts to move in correlation to the yield spread. The fact that this divergence has happened since the liberation day, we can assume that this has something to do with the economic war being waged by both sides of the Geopolitical divide.
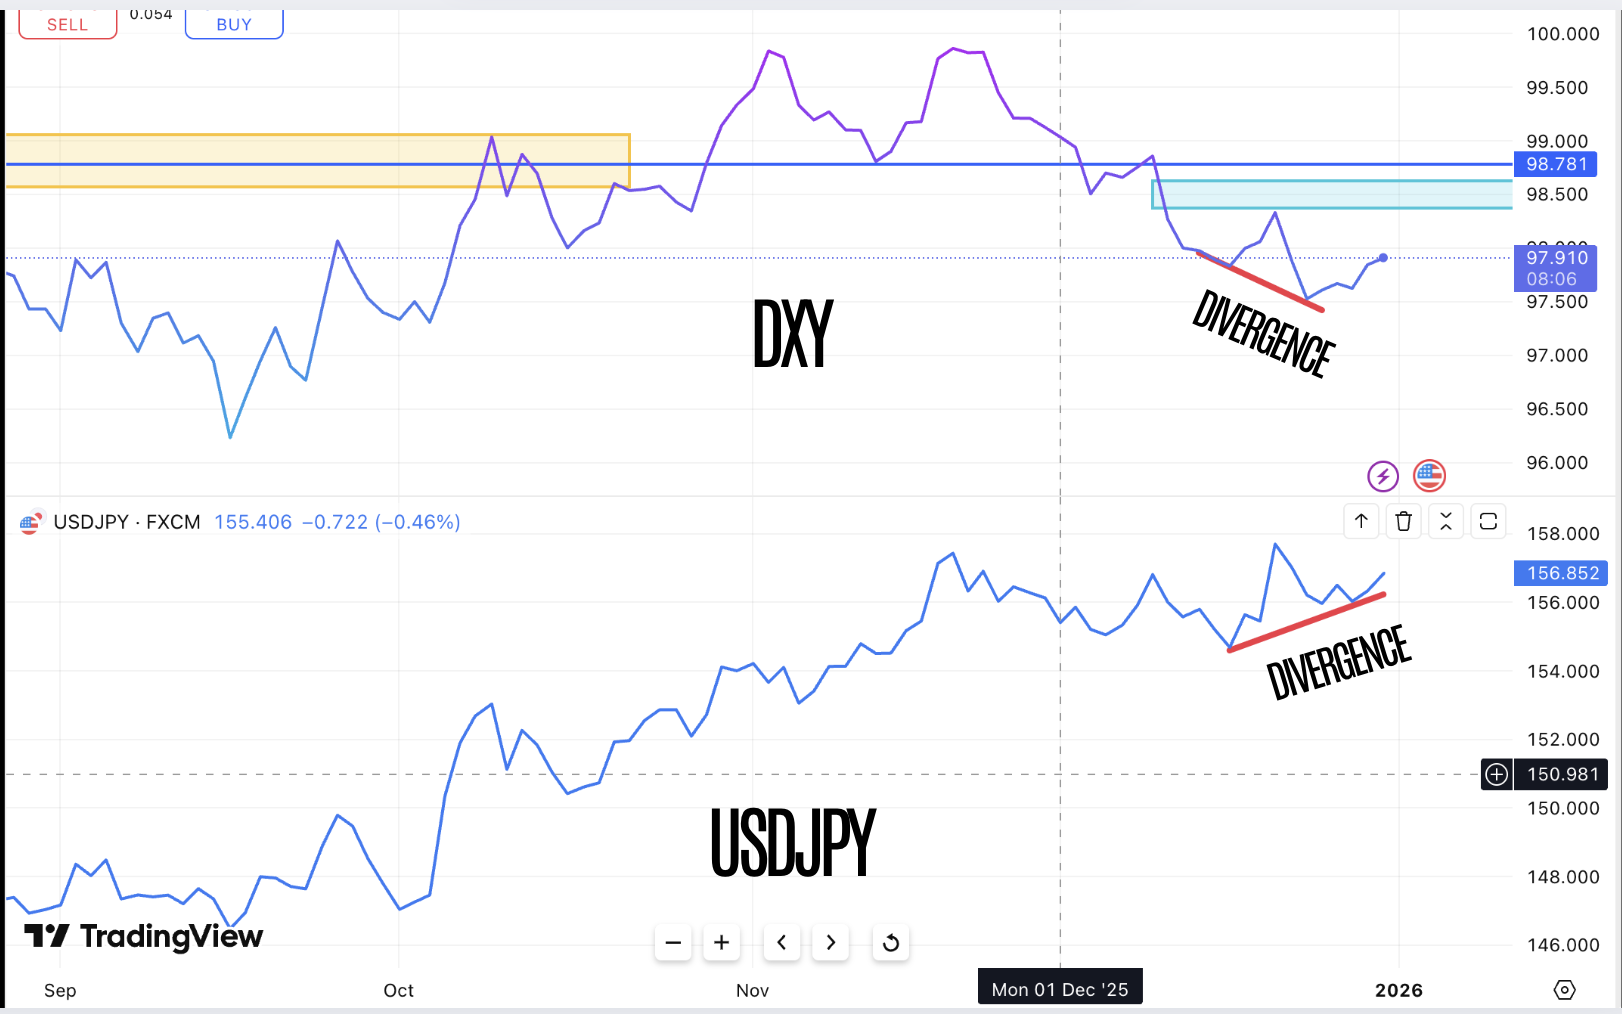
This second chart compares DXY with USDJPY. The idea of doing this is to spot divergence as shown in the chart. This often means manipulation ( most likely by market makers) as there is a crack in correlation. If DXY moves up, then USDJPY also should move up. However we have seen a 10% fall in DXY but USDJPY is rising. We have drawn the divergence. This means that the JPY is weaker than DXY. and so if we are to see a bounce in DXY, then we can expect USDJPY to rise even further. We will now look at USDJPY chart.
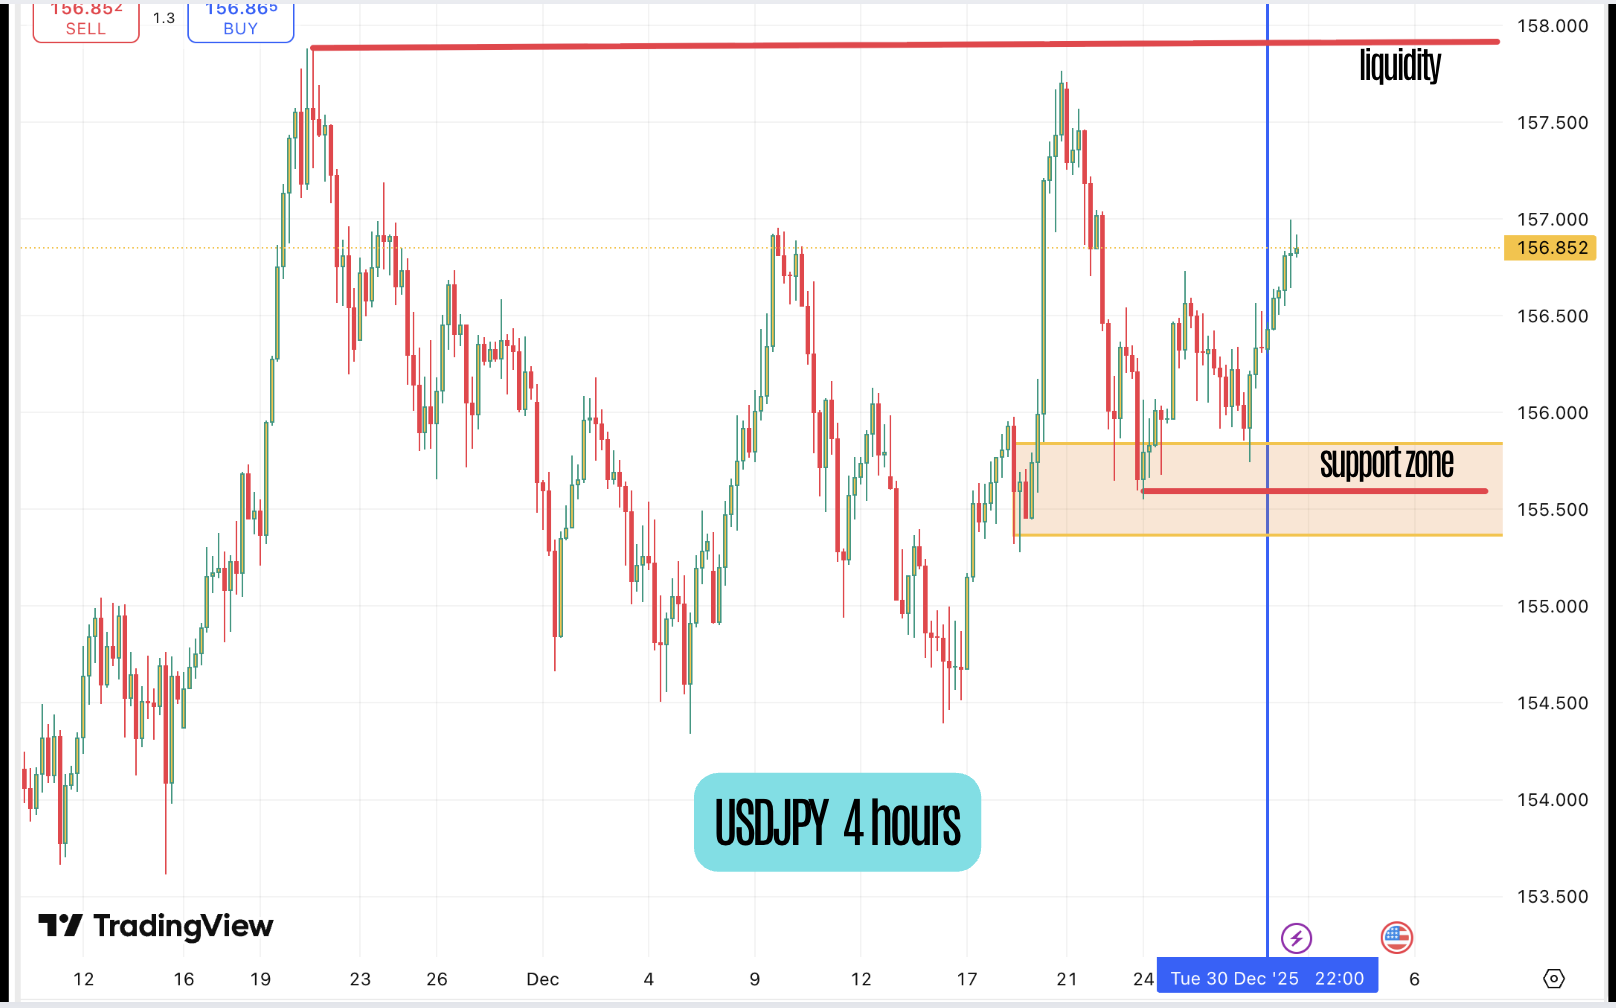
As you can see, the price has held the support zone so far. In our view, as long as the price does not violate the support zone, USDJPY continues to rise and take out the liquidity above. Above this is further liquidity from Q1 2025 high. See previous USDJPY analysis for the chart.
We are long USDJPY and we continue to hold to our positions. We will move our stops to the last low that was formed as you can see.
May the peace of the Lord be with always
Disclaimer; All analysis are Muffett’s own views and does not constitute investment advice.