DXY weekend analysis: 09/11/2025-
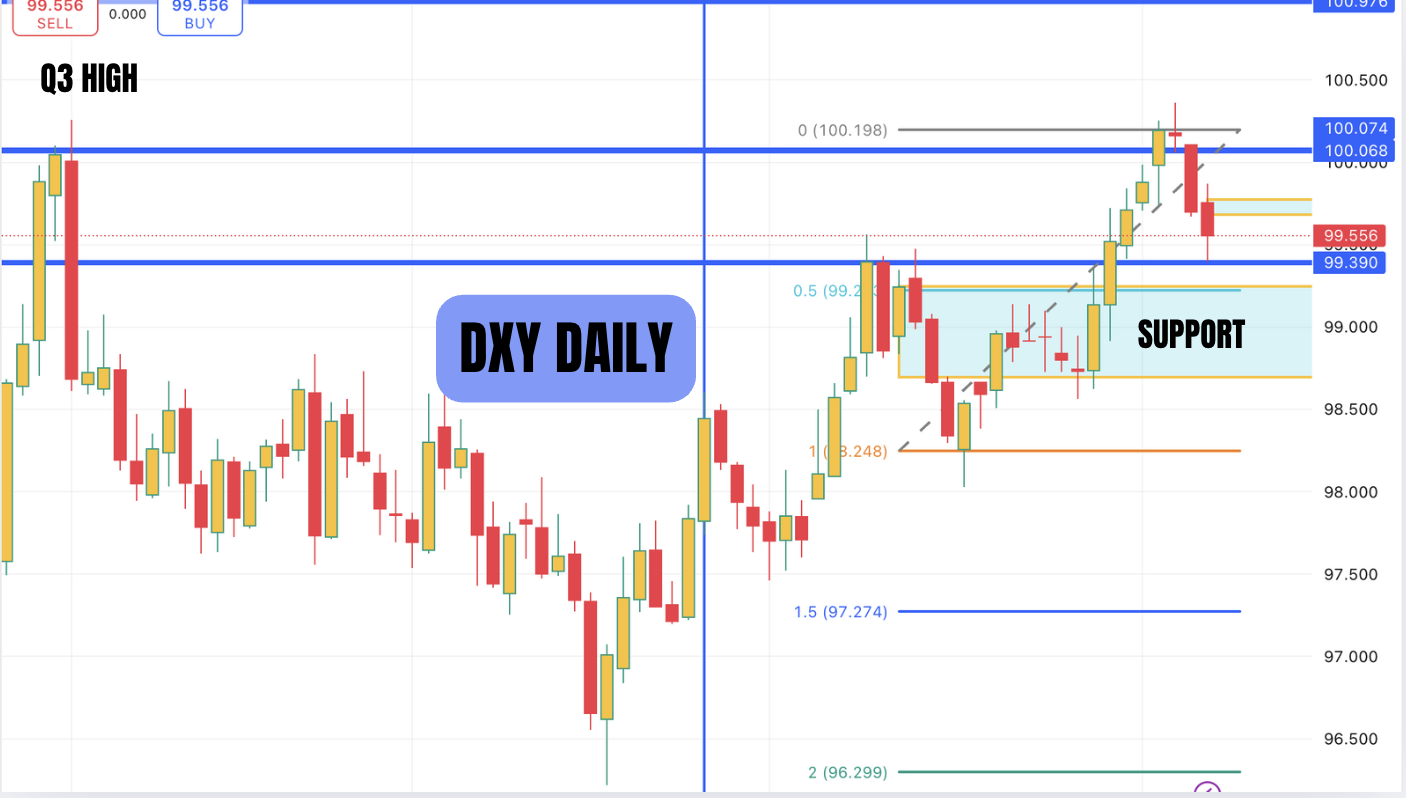
Last week we were expecting the Q3 high to be taken out and this has now happened. As soon as the DXY took the high, it was sold off and it has left bearish pin bar on the weekly chart. Let’s remind us of the fundamental thesis on DXY. We believe that the Trump administration wants to weaken the dollar to help reduce reduce the debt burden and also to help US exporters to be more competitive. When the administration in power ( US being the dominant power currently) has decided to do this, it will likely be accomplished one way or the other. This is our whole thesis on algorithmic trading is manipulation. This is manipulation on a larger timeframe over the years. The shorter time frame manipulation belongs to the market makers.
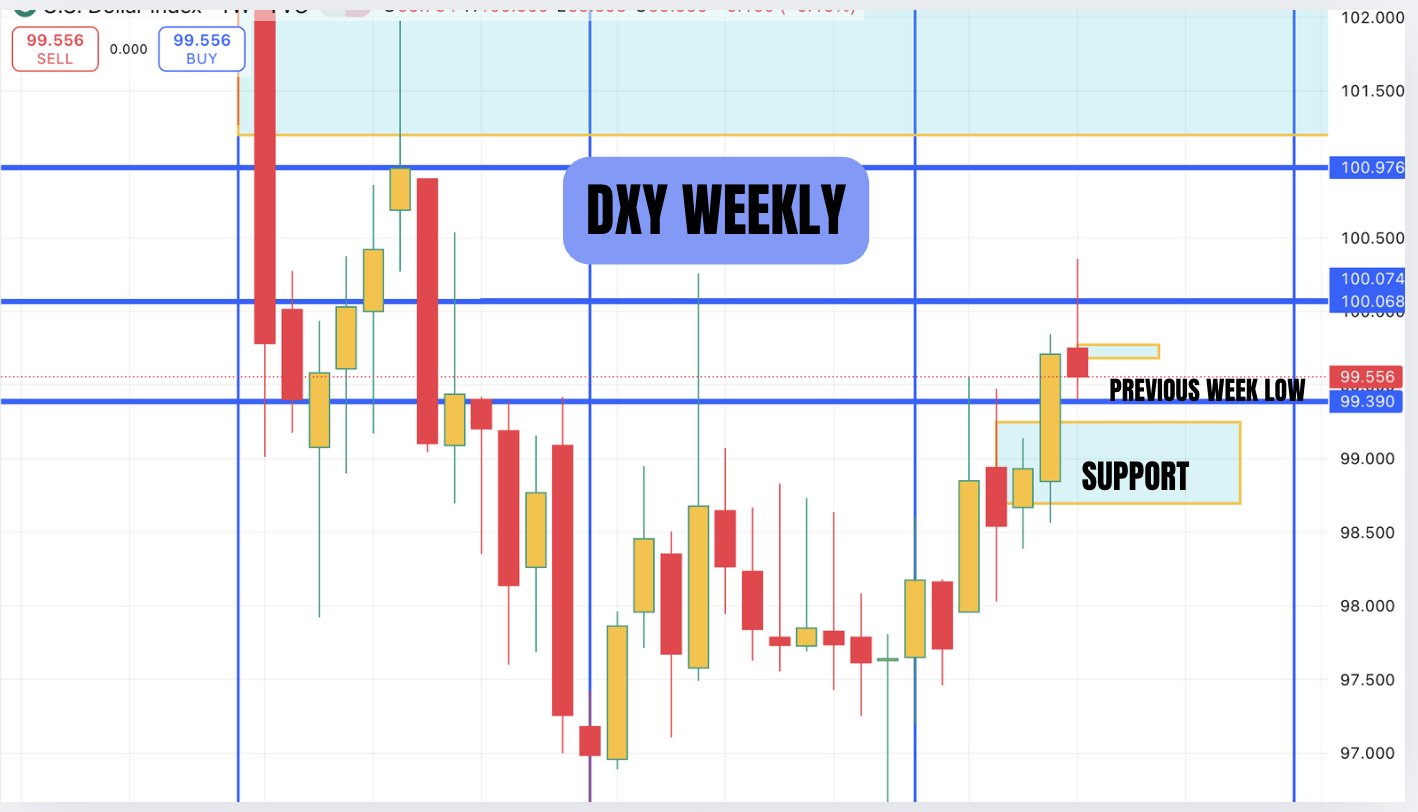
Now coming back to the technical analysis, this bearish pin bar on the weekly suggests that at some point in the next week, the previous week’s low will be targetted. So one idea for next week would be to target the previous weekly low and that means that especially is the DXY goes up in the early part of the week( Monday) than it is reasonable to take longs on GBPUSD and EURUSD. The trades should be closed as soon as the previous week’s low has been taken. But as shown in both the daily chart and the weekly chart, the price is near the support and price is likely to tap into this. What happens at support will determine the next move in the DXY and this will also resolve the direction of gold. We will come to gold later on in this blog.
If the DXY was bullish price will find support in the support zone and price will close above the support. Ideally we dont want a daily close within the support. The criteria for DXY bullishness would be 1. No close within the support zone on a daily basis 2. Price should close above last week’s opening price on a weekly basis. If this happens, then it is very bullish for DXY and we will look for a move into the top blue zone. Targets being 100.97 and 101.50.
If the DXY was bearish, then price will close in to the support on a daily basis. And if price goes below the support on a 4 hour basis, then all retracements back into the support zone is a short on DXY ( longs on GBPUSD and EURUSD). So this week we are very open minded and we are going to go in with a neutral bias and let the market decide for us.
USDJPY ANALYSIS:
Although the Trump administration wants to weaken the dollar, they are not particularly bothered by the weakening of the yen against the dollar. The reason for this is not clear but i think that the USDJPY carry trade is fuelling the stock market bubble and that is one of the reasons why Trump is turning a blind eye to this. I also think that this is the reason why the BOJ is letting the yields go higher ( an attempt to control irrational exuberance).
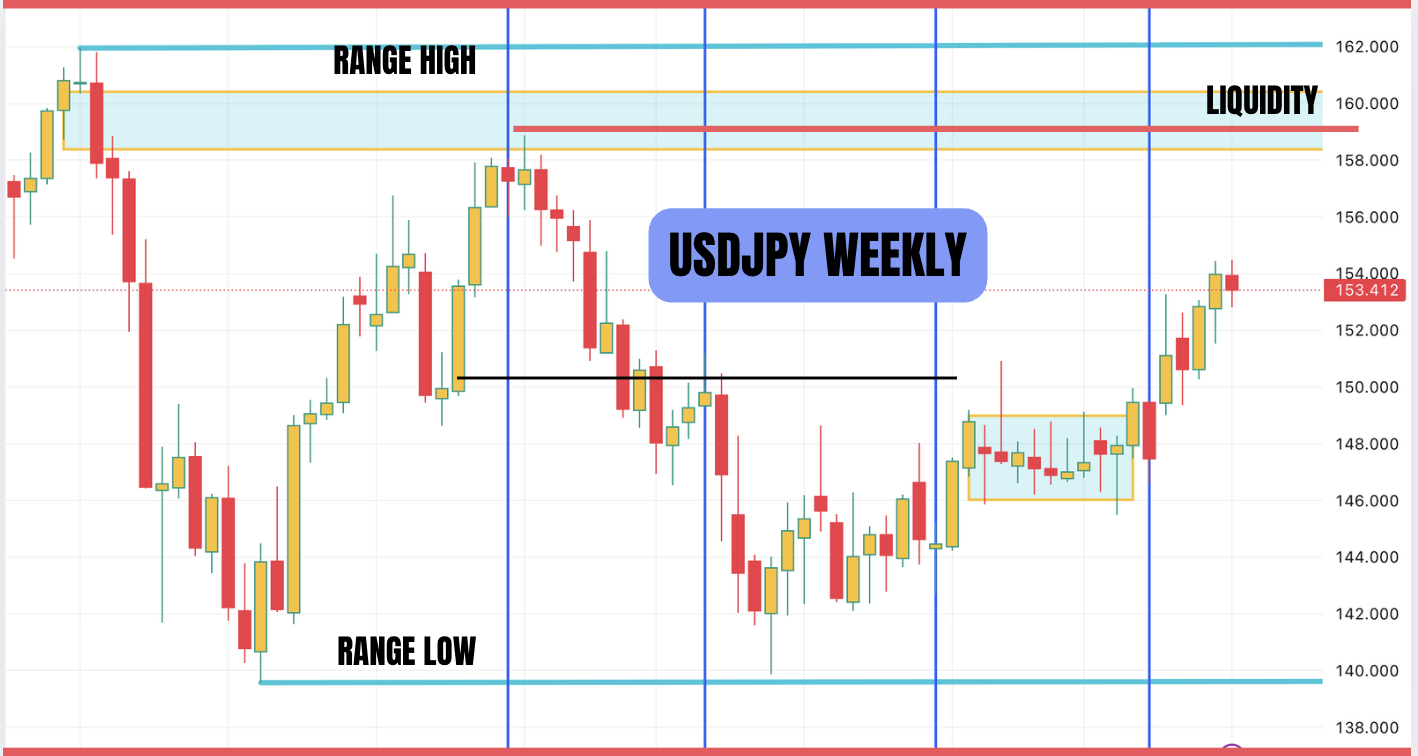
If we see the weekly chart, we have an inside bar. This suggest that once the range is broken, we can have a big move. This could be up or down. we do not know. As we are going with an open mind on DXY, we should also go with an open mind on the USDJPY pair as well. On our previous analysis, we thought that USDJPY could go to take out the Q1 high in the blue zone on the weekly chart.
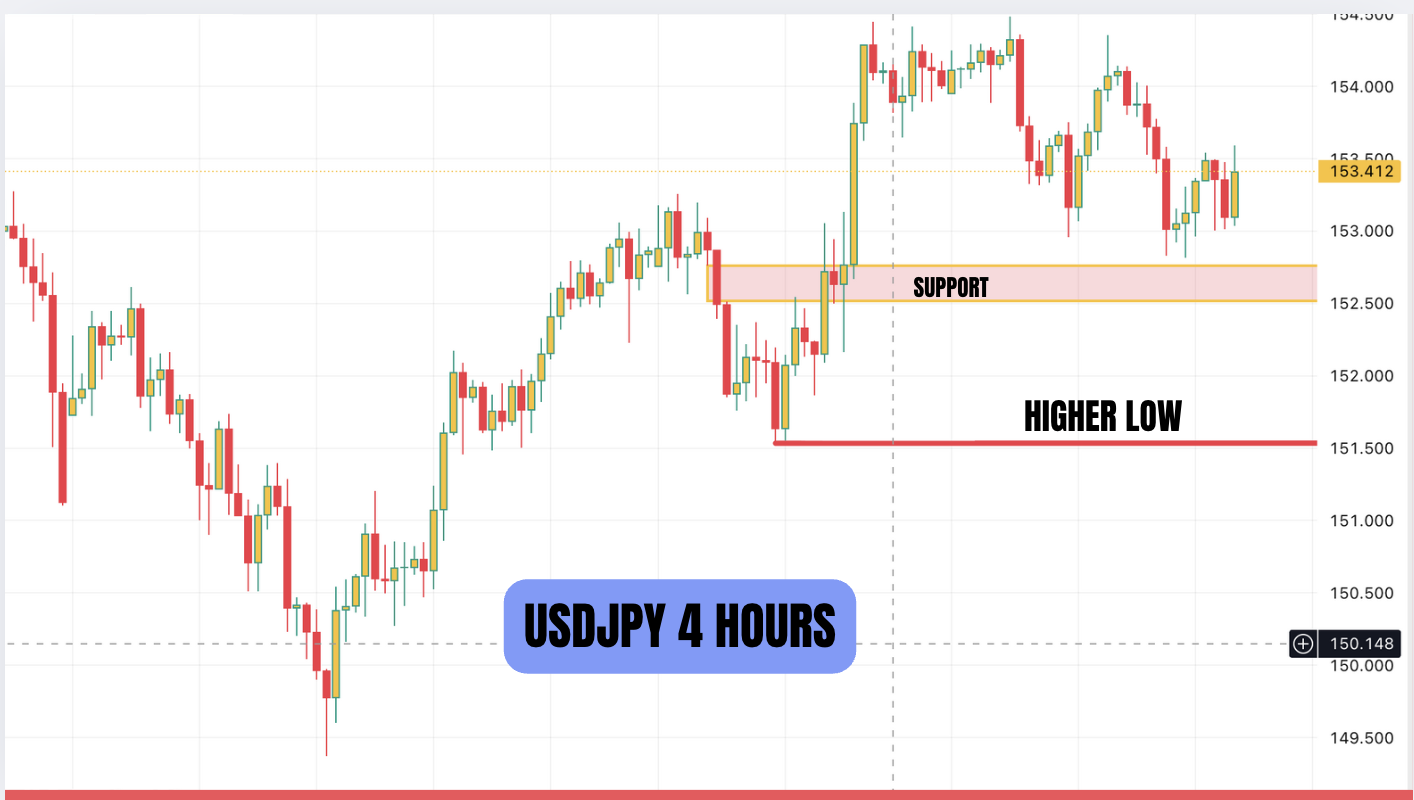
This will depend on the support that we have drawn on the 4 hour chart. If USDJPY was bullish, then price will not lose the support and price will never close below the support on a 4 hour basis. Also we have marked the higher low at around 151.50. This is the last line and if price loses this, then price will go and take out 149.50.
It is a good idea to watch the USDJPY as this will give us clues to other market. If our premise of USDJPY carry trade is right, then if we have a sell off in USDJPY, it should be also be seen in Nasdaq and Gold and both will sell off with USDJPY.

GBPUSD DAILY:
See previous analysis on GBPUSD. We marked the top zone as our short zone. This is our target. The green line was a previous daily low. The price goes below it and then as you can see consolidates for a bit. Then we have manipulation down to stop out the longs, The price is then moved higher. This gives us an opportunity. As long as price does not close below the invalidation line on a 4 hour basis, we will look for longs until we reach our target/ key zone. What happens here will determine what happens next. If GBPUSD is rejected, then we can expect a move lower. If GBPUSD is able to close above the target area, GBPUSD becomes bullish.
Our long trade idea is reinforced by our analysis on DXY which suggests that previous weeks lows will be tested. This would mean higher GBPUSD prices.
The market very rarely moves like we expect when we do the weekend analysis. The market makers can move the market to confuse and false foot us. It is our duty to realign our analysis based on the price action during the week.
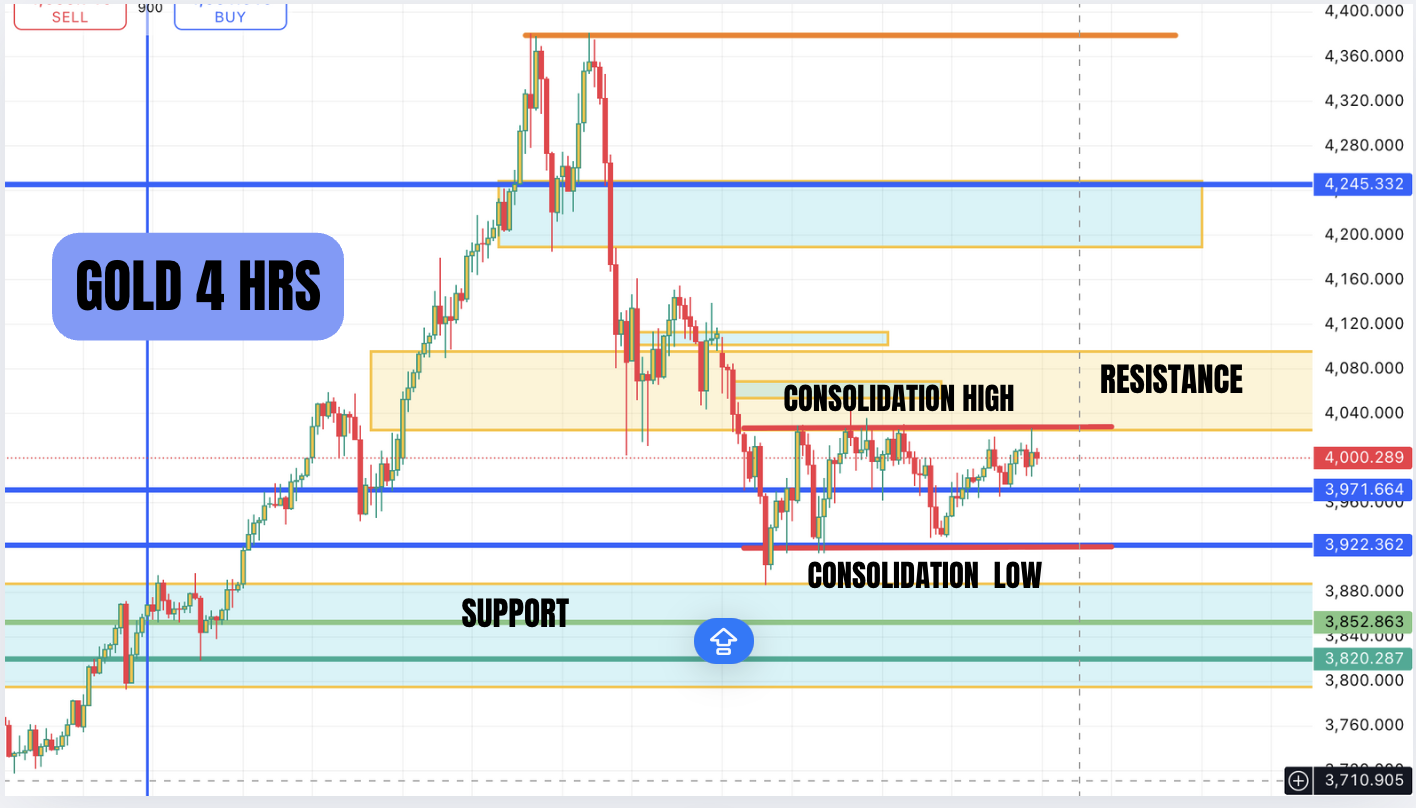
GOLD 4 HOURS:
Finally gold. We are fundamentally bullish on gold. Price in our view is in short term correction. on the 4 hourly chart, price is in consolidation. Our ideal scenario would be for price to come to the support zone first without touching resistance. If price gets rejected here, then we can target the liquidity above. That would be a accumulate, manipulate and distribute pattern of market maker models. Until price leave consolidation, it would be tricky to trade gold.
May peace be with you all.
Disclaimer: All analysis done in good faith and is for educational purposes only and not investment advice.