DXY analysis: 06/11/2025- Just so you know
In trading/investing, we need an edge which is repeatable and does not degrade with time. At Muffett investments, our edge is Liquidity. Liquidity is the stop orders of participants already in the market. At any point of time, two people looking at a chart can be bullish or bearish. So we can expect bullish and bearish participants at all times. The job of the market makers is to provide liquidity and they move the market to areas of liquidity. When we identify areas of liquidity, then we can expect the market makers to move the market there and this is our edge. When manipulation happens, it is not always obvious. But if we study the market long enough, then manipulation can be identified, and then we can participate in the distribution.
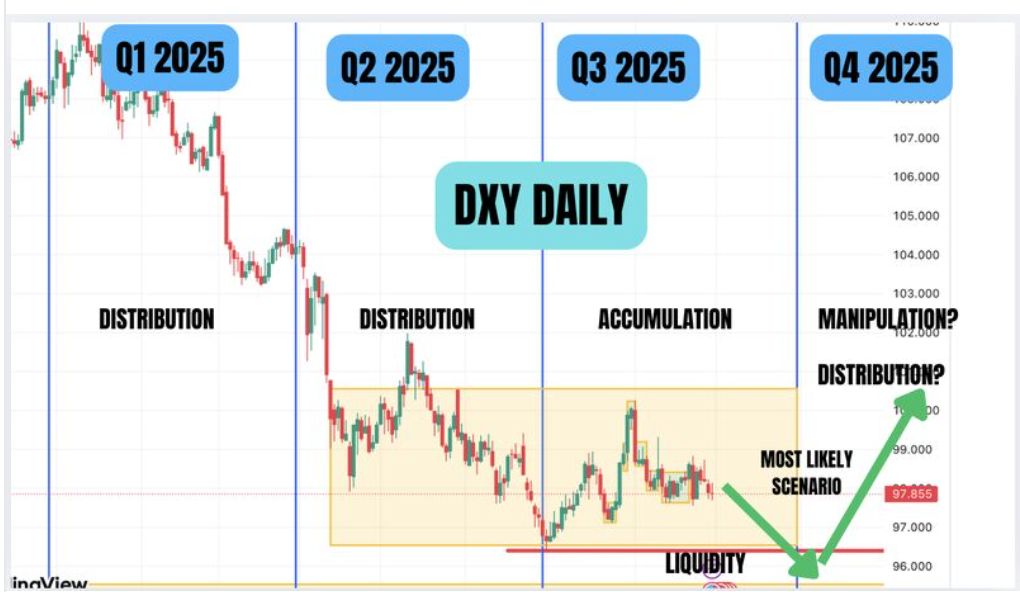
The above is our analysis on DXY about 5 weeks back. we were able to predict what was going to happen in the DXY chart in advance. Now we are wrong several times. That is ok because only the market makers know whether the price move is manipulation or a real move. But all we need is to identify a few of these moves to grow the portfolio. As you can see, when most market participants were bearish on the dollar, we were calling for move lower first to take out liquidity and then a move higher to take out the liquidity ofQ3 HIGH. The link to our post on linkedin is here- https://www.linkedin.com/feed/update/urn:li:activity:7373234685143072768?utm_source=share&utm_medium=member_desktop&rcm=ACoAAE7zOAYBnnmbqW-e4s4uokKwBPNrREkRg38 and here https://www.linkedin.com/feed/update/urn:li:activity:7376245816933371904?utm_source=share&utm_medium=member_desktop&rcm=ACoAAE7zOAYBnnmbqW-e4s4uokKwBPNrREkRg38

The second chart is the chart from today. We have marked the purges of liquidity below and above the Q3 range. Now we have to determine what will happen next. This is the time to wait. We have had a very shallow raid of the Q3 high. It is our view, that the price can go higher after a retracement. But we have also noted a divergence between DXY and EURUSD at highs. DXY made a higher high while EURUSD made a higher low. In a symmetrical market, EURUSD would have made a lower low. This crack in correlation in itself should not be considered a manipulation. But when we see a structure break on the daily or 4 hour chart, then it is very likely that manipulation has happened. This exact crack in correlation happened at the lows and it helped us predict the DXY higher.

Both USDJPY and GBPUSD has been manipulated to achieve this. So we are on the watch out for break in structure. Until a break in structure happens, we should maintain a bullish bias. We will now look at the 4 hour chart of DXY and we will look at what level the DXY needs to break before it can be considered bearish. We use the FVG for this. The FVG act as support and resistance. When we lose the last support, then the bullish bias will be invalidated.
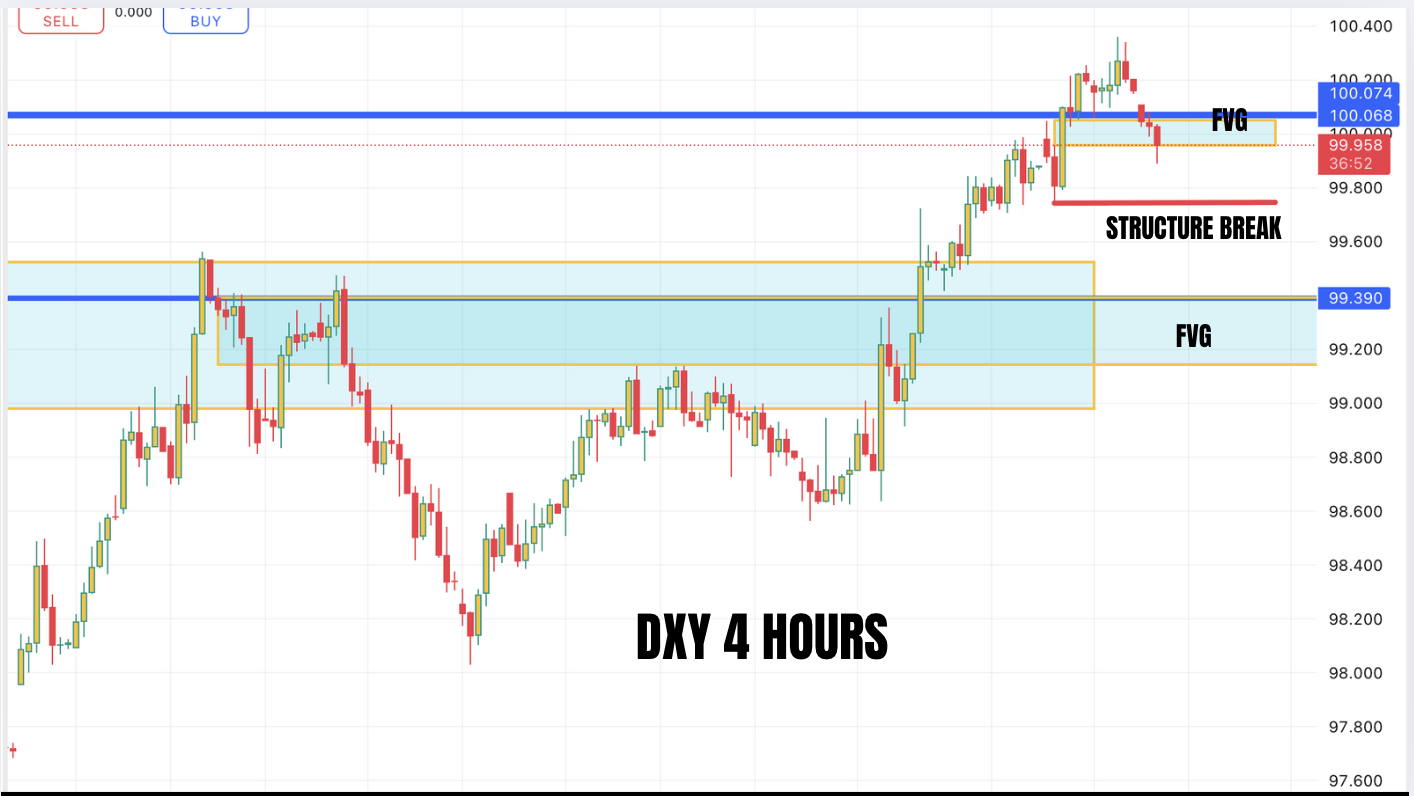
The DXY 4 hour chart shows that we are about to lose the FVG support at the top. If the price break below the swing low, the short term 4 hour chart will bearish. However, we can have deep retracements within a bullish trend and until the lower FVG is broken, we can stil maintain a bullish bias. We will be watching closely the price action in NY session today 06/11/2025. This will tell us whether we keep our USDJPY positions or close them. It will also guide us if we can take short term shorts on DXY if price breaks the swing low leading to structure break.
Disclaimer; Analysis done in good faith and is Muffett’s own views on the market and does not constitute investment advice. We do this for educational purposes only.