GOLD and the Gold miners:

Analysis done on 5/11/2025:
The above is the daily chart of Gold. Price has corrected more than 10% from the highs. The orange shaded area was support but it is now resistance. If you were to see the 4 hour chart, you see that price bumped into resistance several times before price started to weaken again. We will be watching the price action in gold closely in the blue zone. it is very likely that the price will hit this zone in the next few days. It has 2 areas of significance and potential turning points. The first is the 50% retracement of the move at $3850. The second is the previous month low at $3820. It would be favourable to our bullish thesis if price immediately reverses and closes above the blue zone. It would be less favourable if price closes within this area on a daily basis.
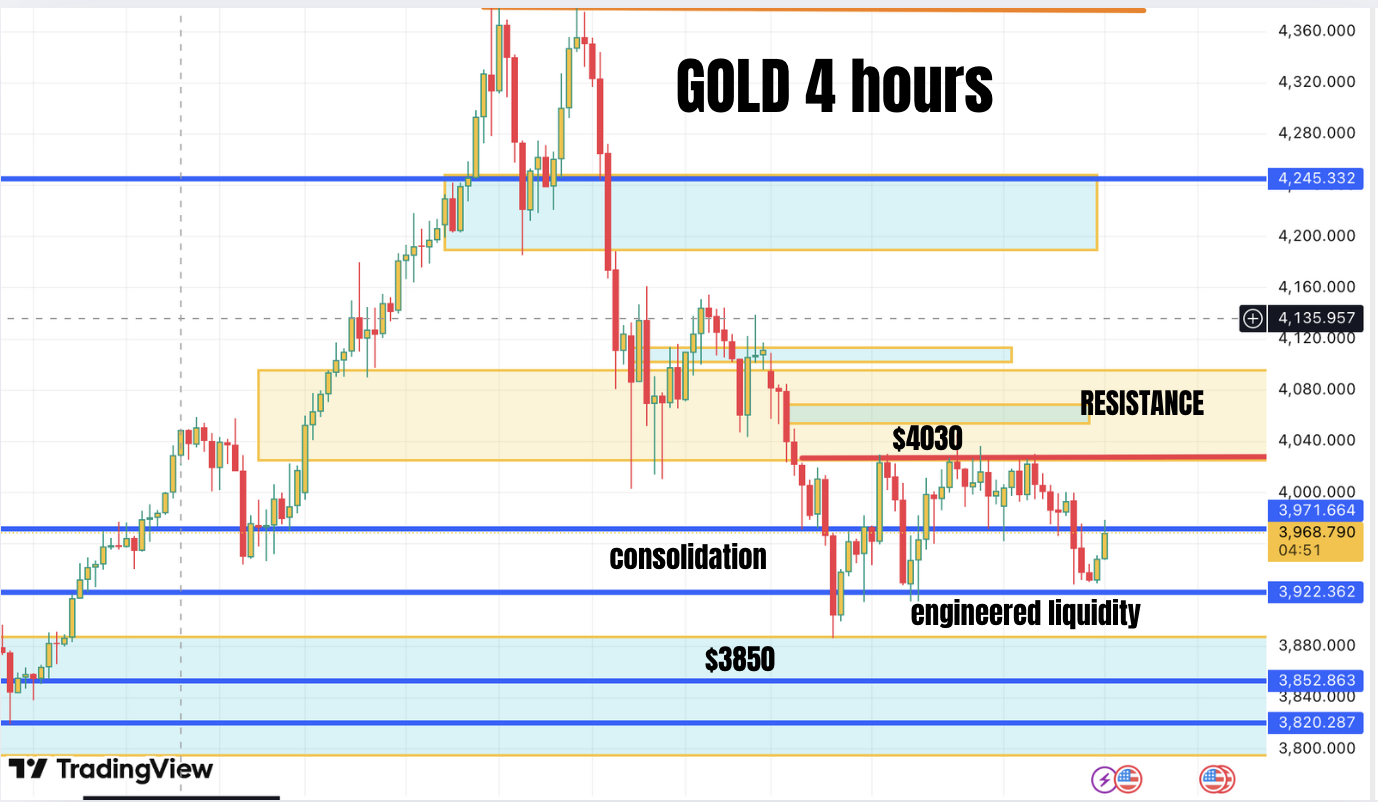
This is the 4 hour chart of Gold. We are currently consolidating on the 4 hour timeframe. The resistance is $4030. The support zone is below. The market makers have engineered liquidity below as marked on the chart. From an algorithmic perspective, it would be better if the market makers take out the liquidity below in the next few days. If price comes to the blue zone and immediately rejects it, then it is very likely that we will have a big bounce. and we can expect the price to go to the top blue zone.
.This is likely to be taken before the end of this year. The chances of price going back to test the TOP Blue zone is >50% in our view. So we think that the blue zone is a buy zone and we will be looking for buy setups in the lower blue zone.
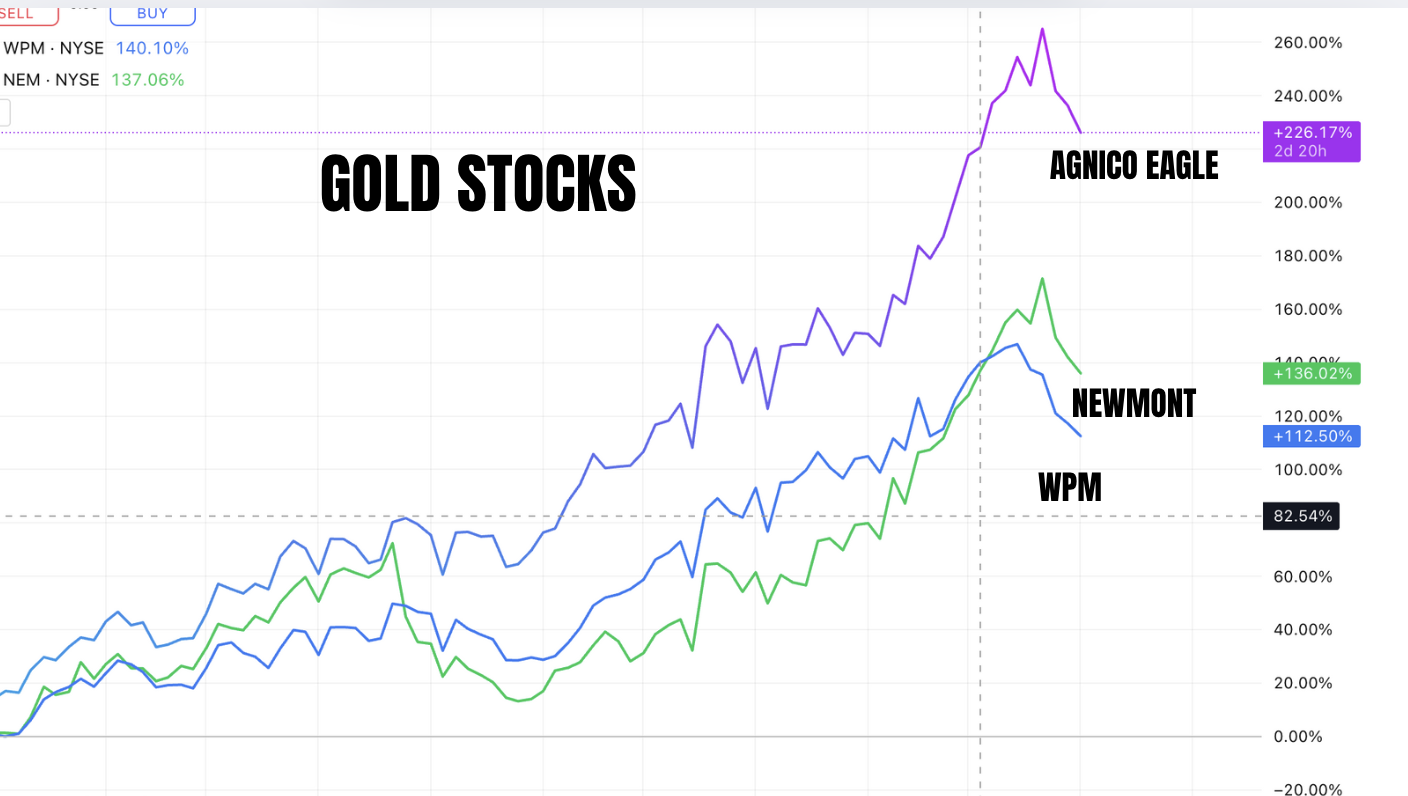
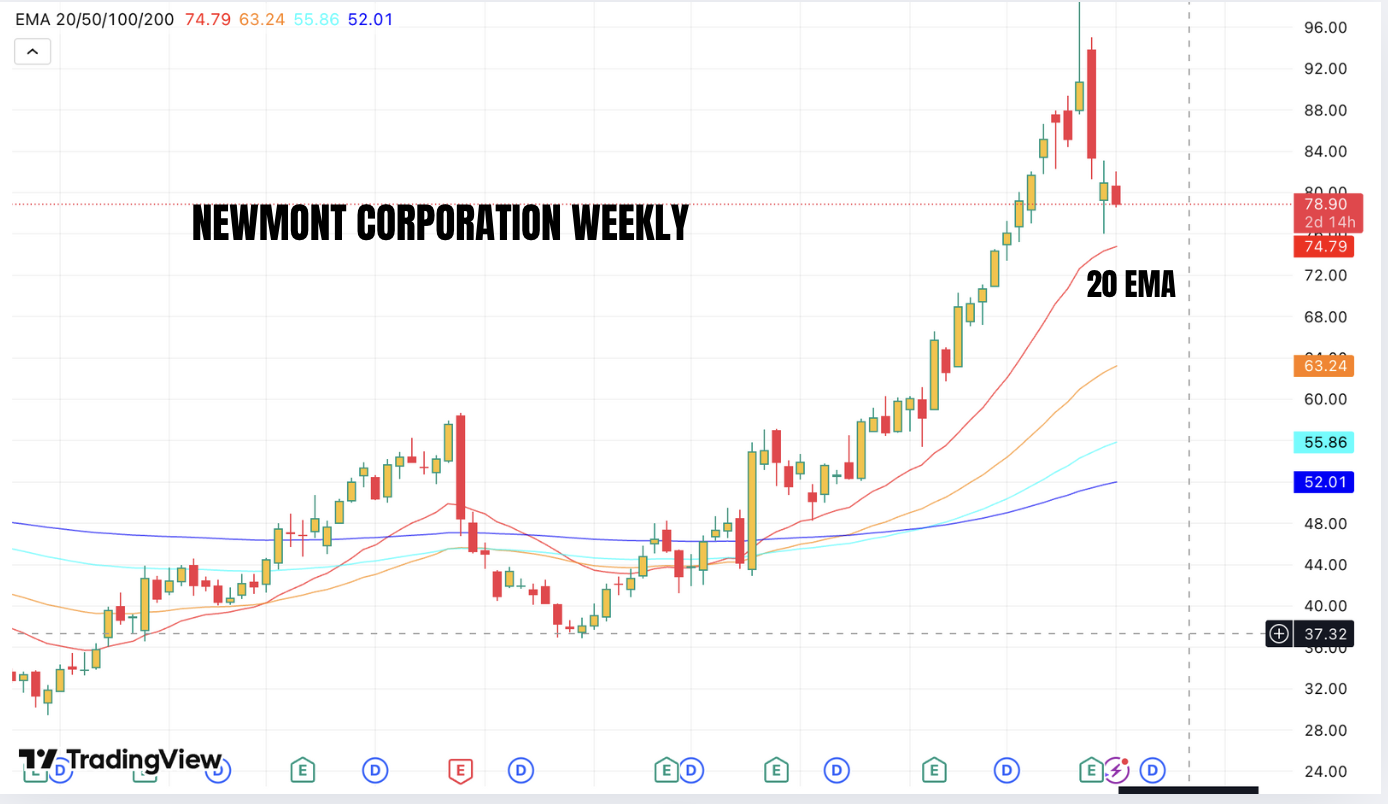
The above chart compares the 3 biggest and strongest miners and streamers. WPM is a royalty company and is showing relative weakness even though previously it had been strong. Agnico Eagle is the strongest as its AISC is lower compared to Newmont. But Newmont will give asymmetric exposure to rise in gold prices as it has much higher production than Agnico Eagle. We will initiate longs in the model portfolio at the time the gold reached $3850 or if the individual weekly chart of each of the come to their respective 20 week EMA. WPM has already touched its 20 week EMA but as it is the weakest we will wait for Newmont to touch its 20 week EMA to buy both WPM and Newmont in oue model demo portfolio.
Disclaimer: Above analysis is done in good faith and does not constitute investment advice. These are our own views and is for aducational purposes only.