DXY weekend analysis: 15/11/2015


We have the DXY daily and weekly chart uploaded. Last week we were looking for a raid of the previous week’s low and the reaction of the price when it reaches support. We did have the raid of the low and price tested support and managed to close just about support. Although the price action is not very encouraging, it is important to keep our bullish bias until the technicals have proved us wrong. That would mean DXY losing support. The support is marked on both the weekly and daily chart. So heading into next week, we want to see how the price reacts at the support. If the price closes below the support, then we look for shorts on DXY and look for longs on GBPUSD and EURUSD. We also look to see if price can close above last week’s high. it would be bullish if price tests support but never comes to the previous week’s low. And If the price can close above last week’s high, DXY is bullish and we will look for continued move higher to go into the top blue zone and take out the high of Q2.
At the present although we are bullish on DXY, we do not have enough edge to take shorts on GBPUSD and EURUSD. We sometimes take intraday trades which may target short term liquidity either with the trend or against the trend. But those trades are beyond the scope of this analysis.
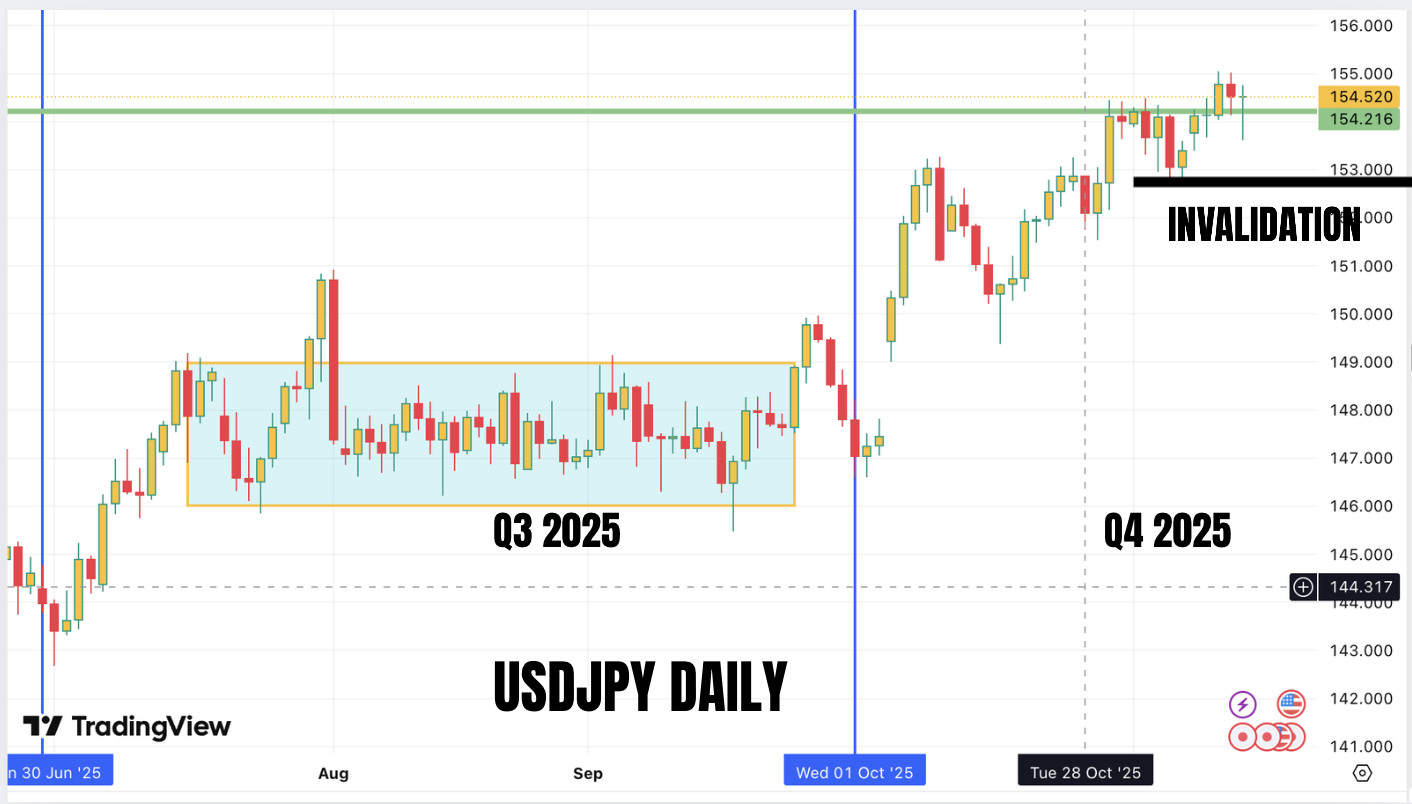

We have a different view on USDJPY. We are sharing the daily and weekly chart of USDJPY. Please refer to the weekly chart first. We can see that the price took out previous week’s high at a time when DXY was showing weakness. This suggest that JPY is much more weaker than DXY. For next week, we will continue to look for longs on USDJPY as long as price is above the invalidation. If DXY starts to rally, then USDJPY will make big moves. So if DXY starts to strengthen next week, then we will be much more aggressive on our USDJPY longs. We think that USDJPY carry trade is funding the moves in US indices and Gold. On this basis, we should not expect a big sell off in both the indices and gold as long as USDJPY is trending up to its Q1 HIGH around 158 - 160. If the price goes below the most recent lows, then the short term bullish bias would be invalidated.

We noticed an interesting divergence when we were doing this analysis. We are comparing DXY, USDJPY and USDCHF. We can see DXY and USDJPY making higher lows but USDCHF is making lower lows. we have not studied this divergence previously and so we will be watching how this divergence gets resolved. Whenever the divergence happens, it is a crack in correlation and will usually mean manipulation. As CHF is now considered as safe haven currency, is the market expecting a big sell off in the equities market or a credit event for USDCHF to show this accumulation.

We have 6 weeks to the end of 2025 and of this the last 2 weeks will see little movement. we also have the thanksgiving holiday in between. so we think that gold will not move our of the current range this quarter. We have marked the range low and range high and we think that price will be in consolidation. We could be wrong but this is the scenario that we are working on. We expect a raid of the Q4 LOW at some point next year before a move higher. we are still fundamentally bullish on gold and we continue to look at scenarios for higher gold prices. None of the fundamental factors that we have considered has changed. This consolidation period will likely be used by market makers to accumulate more positions before move higher. So buy near low of the range and sell near the top of the range would be our plan for next week. However we may have adjust our plans depending on market action.
Disclaimer: Analysis done in good faith and is not investment advice. It is Muffett’s own views and is intended for showing Muffett’s algorithmic trading.