The less people know, the more stubbornly they know about it: DXY and USDJPY analysis

Today we are going to have a look at the forex market mostly focussing on the DXY and USDJPY. we have not covered the Forex market as frequently as we normally would mostly because the Forex market had been in a consolidation for more than a year and now it is moving out of the range and this is what makes it interesting for us. So as the opportunity arises, there will be more coverage on the forex markets from Muffett investments.
Please have a look at our last analysis one on the 11th of July which gave a roadmap for DXY for the next 5 months. The link is here.-https://www.muffettinvestments.com/dxy-forex-analysis/dxy-roadmap-6-months-outlook-using-algorithmic-concepts
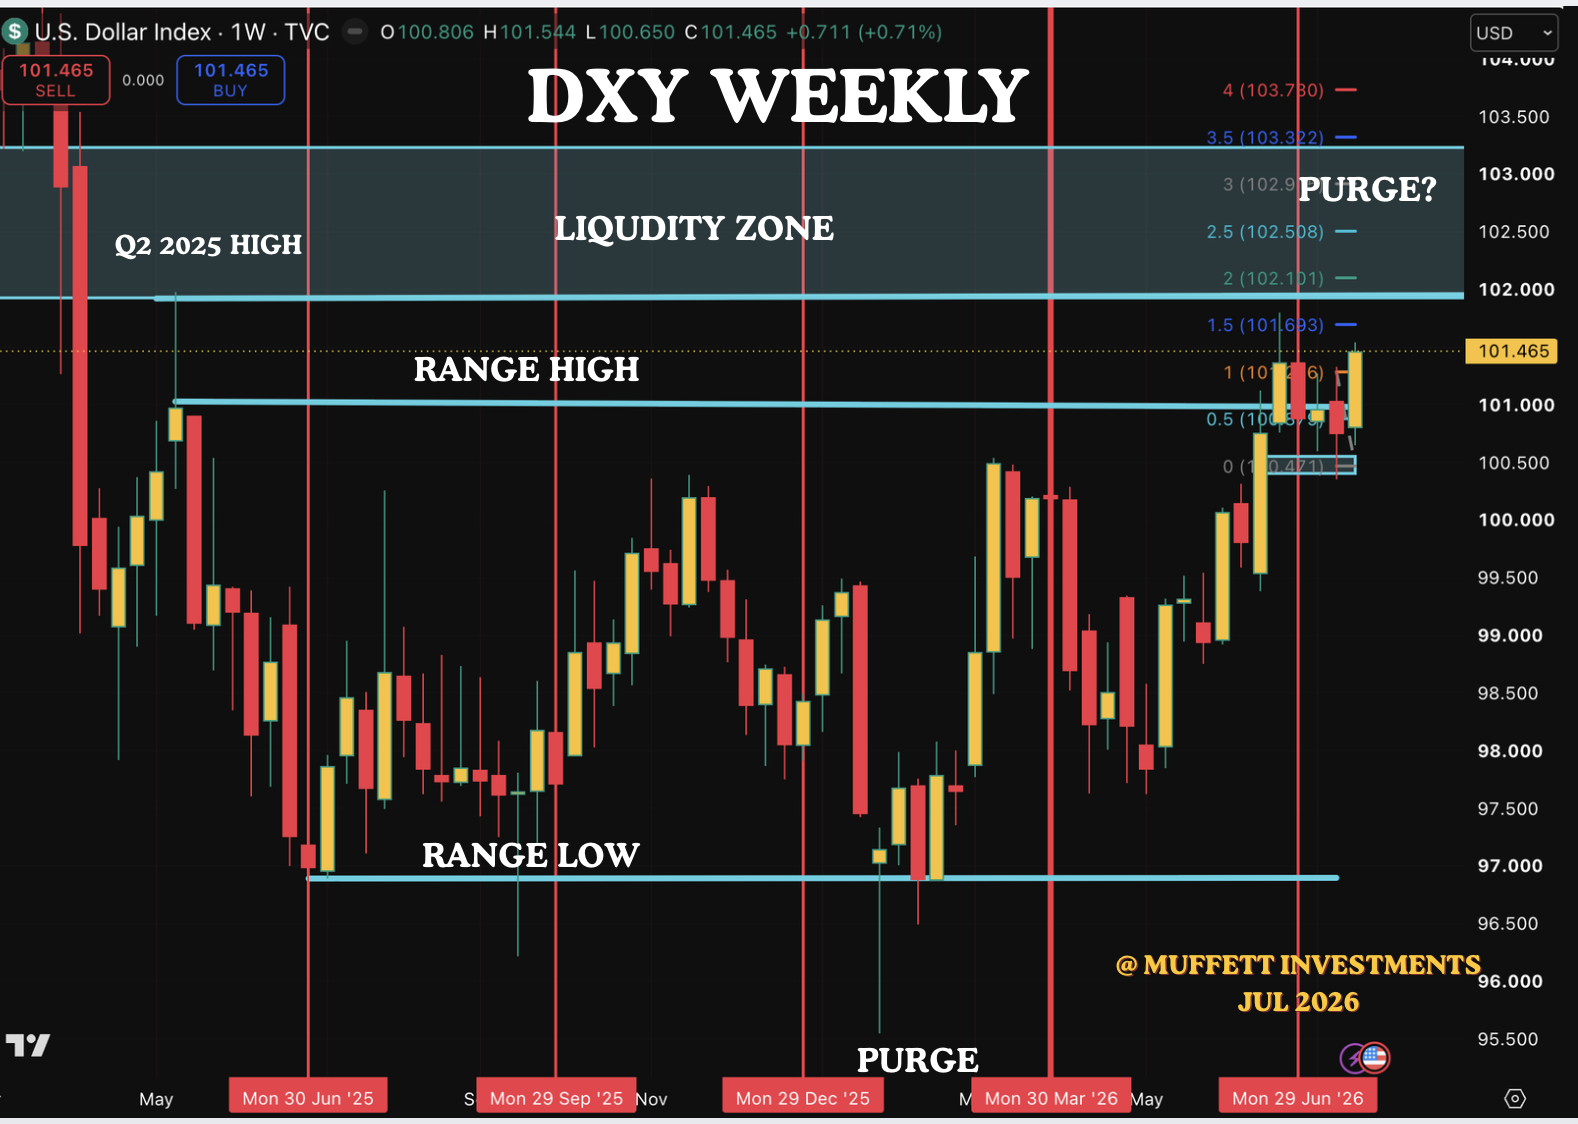
Here is the weekly chart of the DXY. As noted we have been in consolidation for more than a year following steep decline in DXY when Trump introduced tariffs. The price attempted a bounce in Q2 2025 and was quickly sold. Why is this important? This is important because many transnational companies who wanted to hedge their exposure to the US dollar would have their stoploss orders above this high and this liquidity is like a magnet which attracts the price. When price is in close proximity to an important liquidity level, there is a very good chance that price will take this liquidity. So our best chances of success at the moment would be to look for longs on DXY on any retracements to target this Q2 2025 high. This means looking for shorts on GBPUSD, EURUSD and longs on USDJPY. It is important to remember that inorder to keep the risk low, we do this on retracements. This reduces our overall risk incase the thesis is wrong.
Also if you look at the purge which happned Q1 2026 ( Purge is when price attempts to break out of a range and quickly reverses and closes within the range) the sellside liquidity was taken and so once the sellside is purged, then there is a higher probability of price going to the opposite side of the purge. which is buyside liquidity which has now been taken.
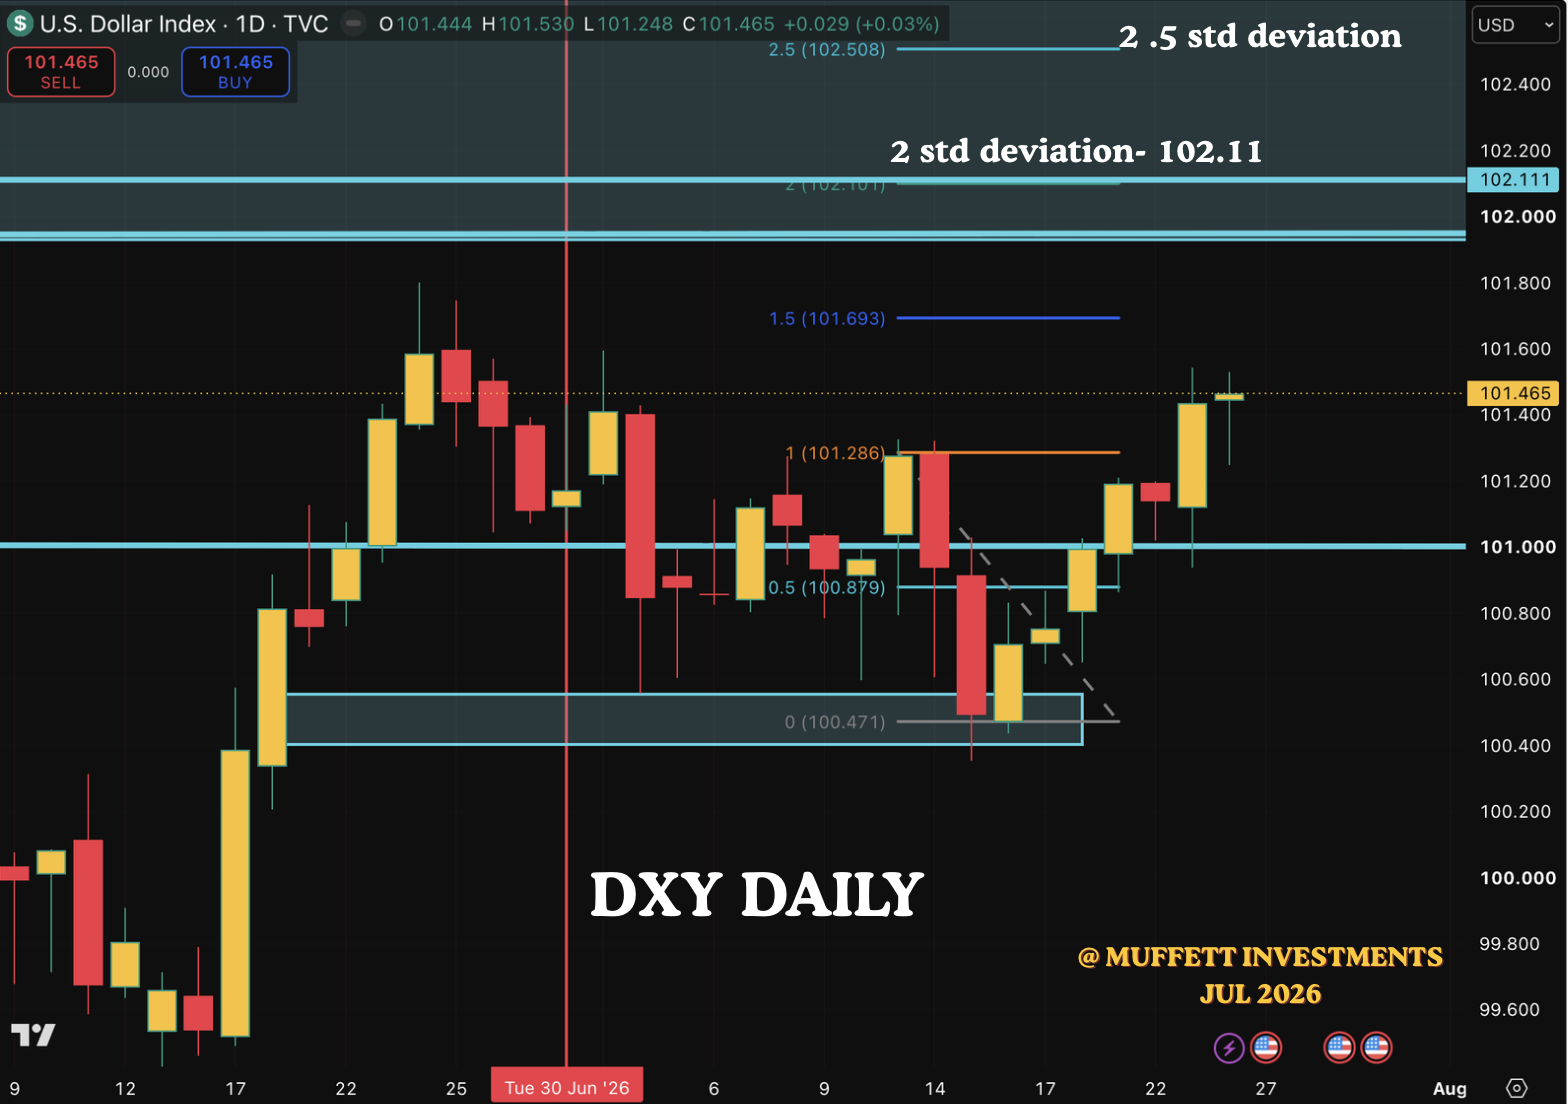
Now lets look at the daily chart. we were anticipating the DXY to find support in the support zones and it did find support in the higher zone. this indicates strength and particularly with oil prices high, the DXY has an advantage as it is a net exporter of fuel and they are targetting the Russian energy infrastructure. So it maybe that the DXY will go much higher than what we previously anticipated provided the war in the Middle East continues.
we have drawn standard deviation projections for potential moves on the DXY. The GBPUSD was manipulated higher to hide distribution in EURUSD. So we think that GBPUSD will start to fall heavily into the next two weeks and take out sellside liquidity. We will now turn our attention to USDJPY. We have not covered this pair for quite a while. The last time we covered it, we noted a divergence between USDJPY and DXY and we were expecting the price of USDJPY to take our sellside liquidity before a move up. But that divergence was quickly invalidated and price continued to move higher and has broken out of the range. lets have a look at the chart.
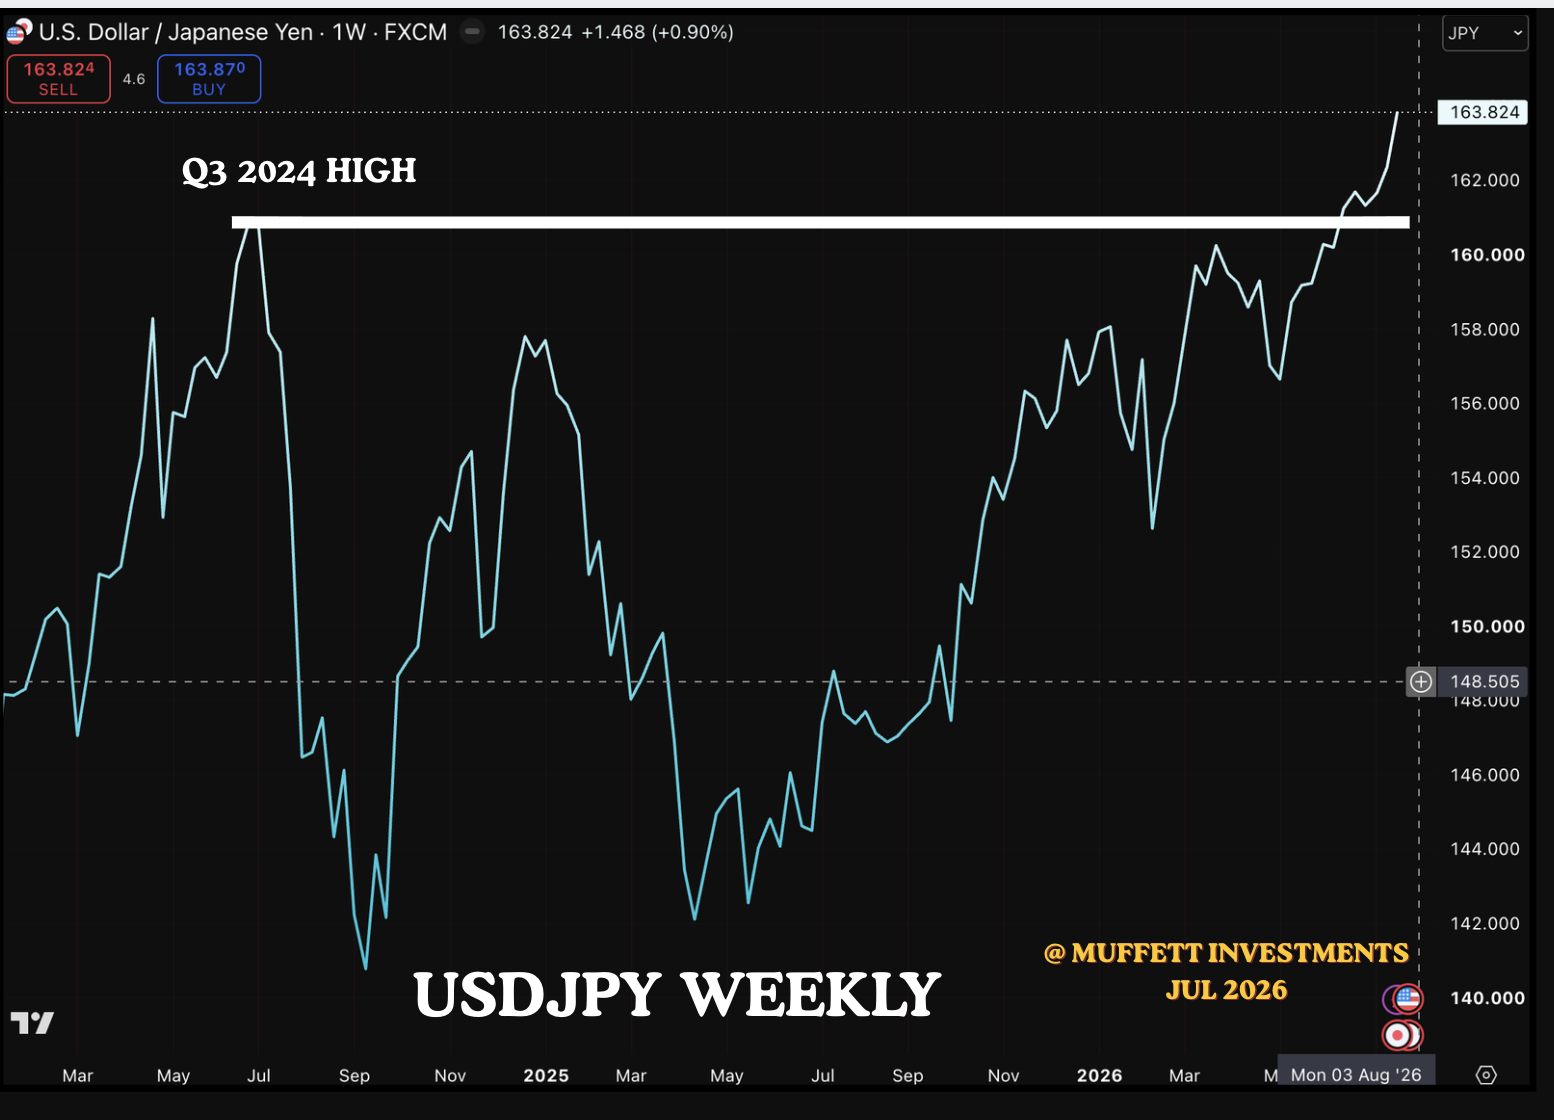
As you can see, the price has closed above Q3 2024 High. This again a multiyear breakout which we can see on the monthly chart below.
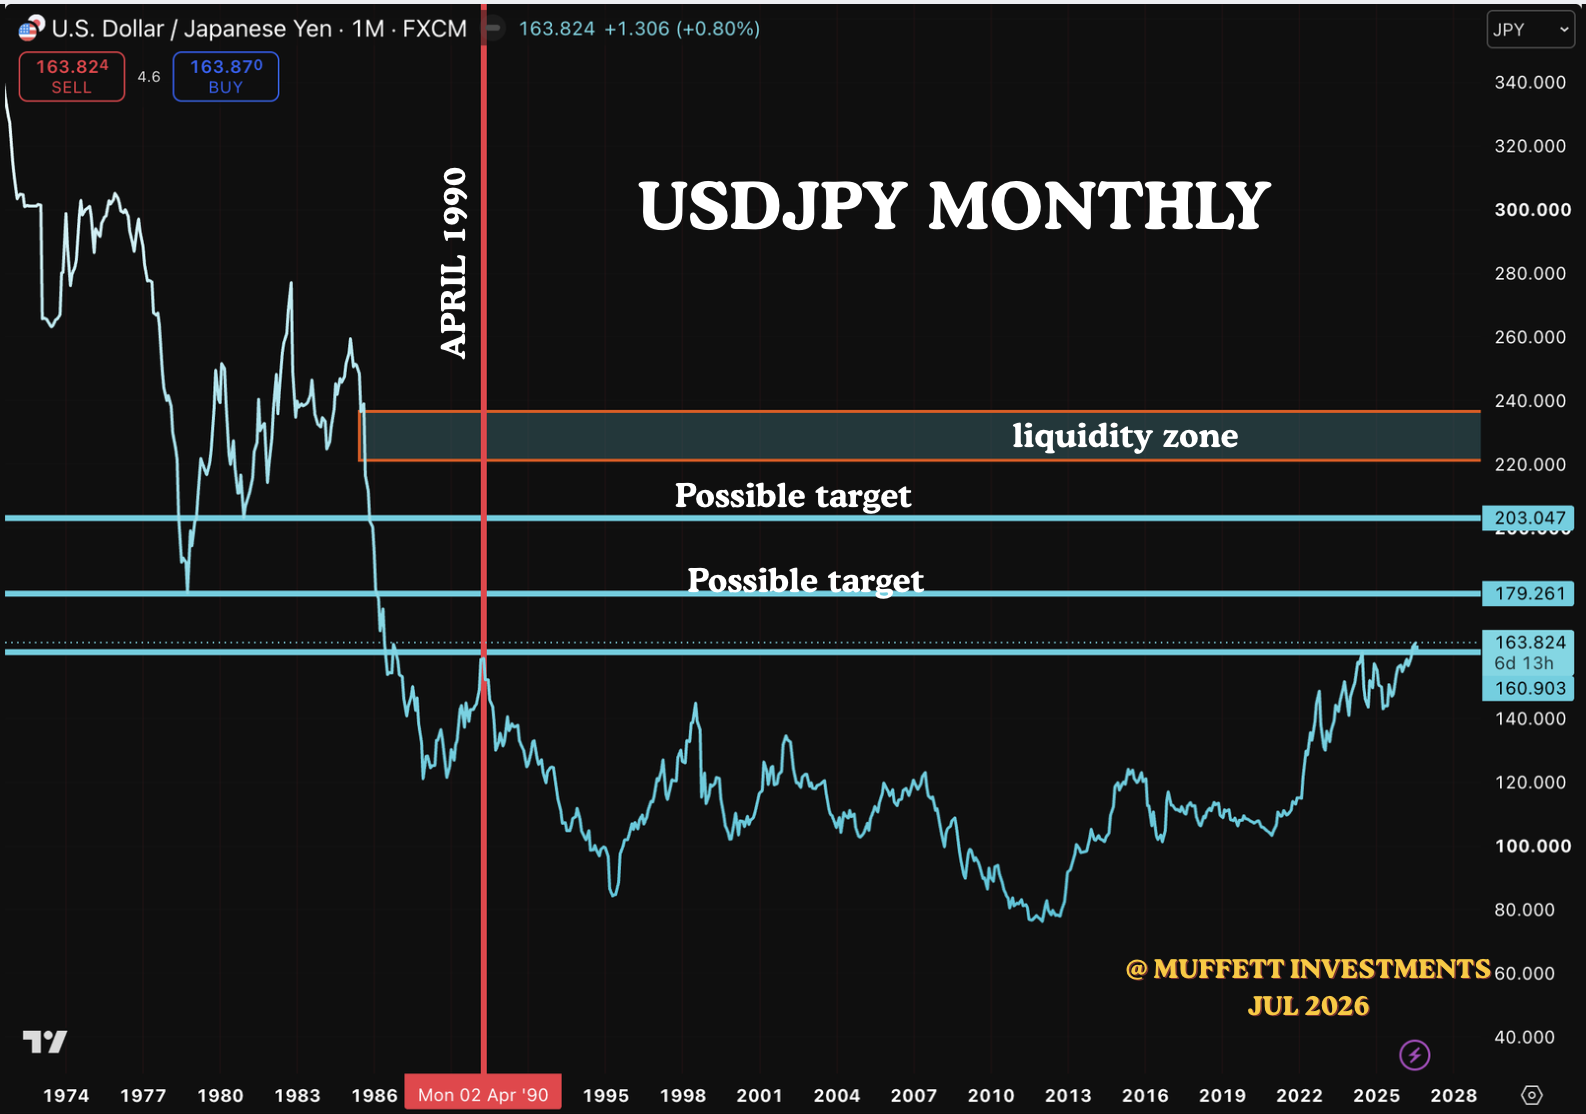
This is important. We are looking at a multiyear chart. The last time the price was at this level was in 1990 almost 35 years ago. And in our view, there is a chance that price can continue higher. The caveat to this is that price should not close below that horizontal breakout line on a monthly basis. So any retracements on USDJPY is a buy until the price action invalidates this idea.
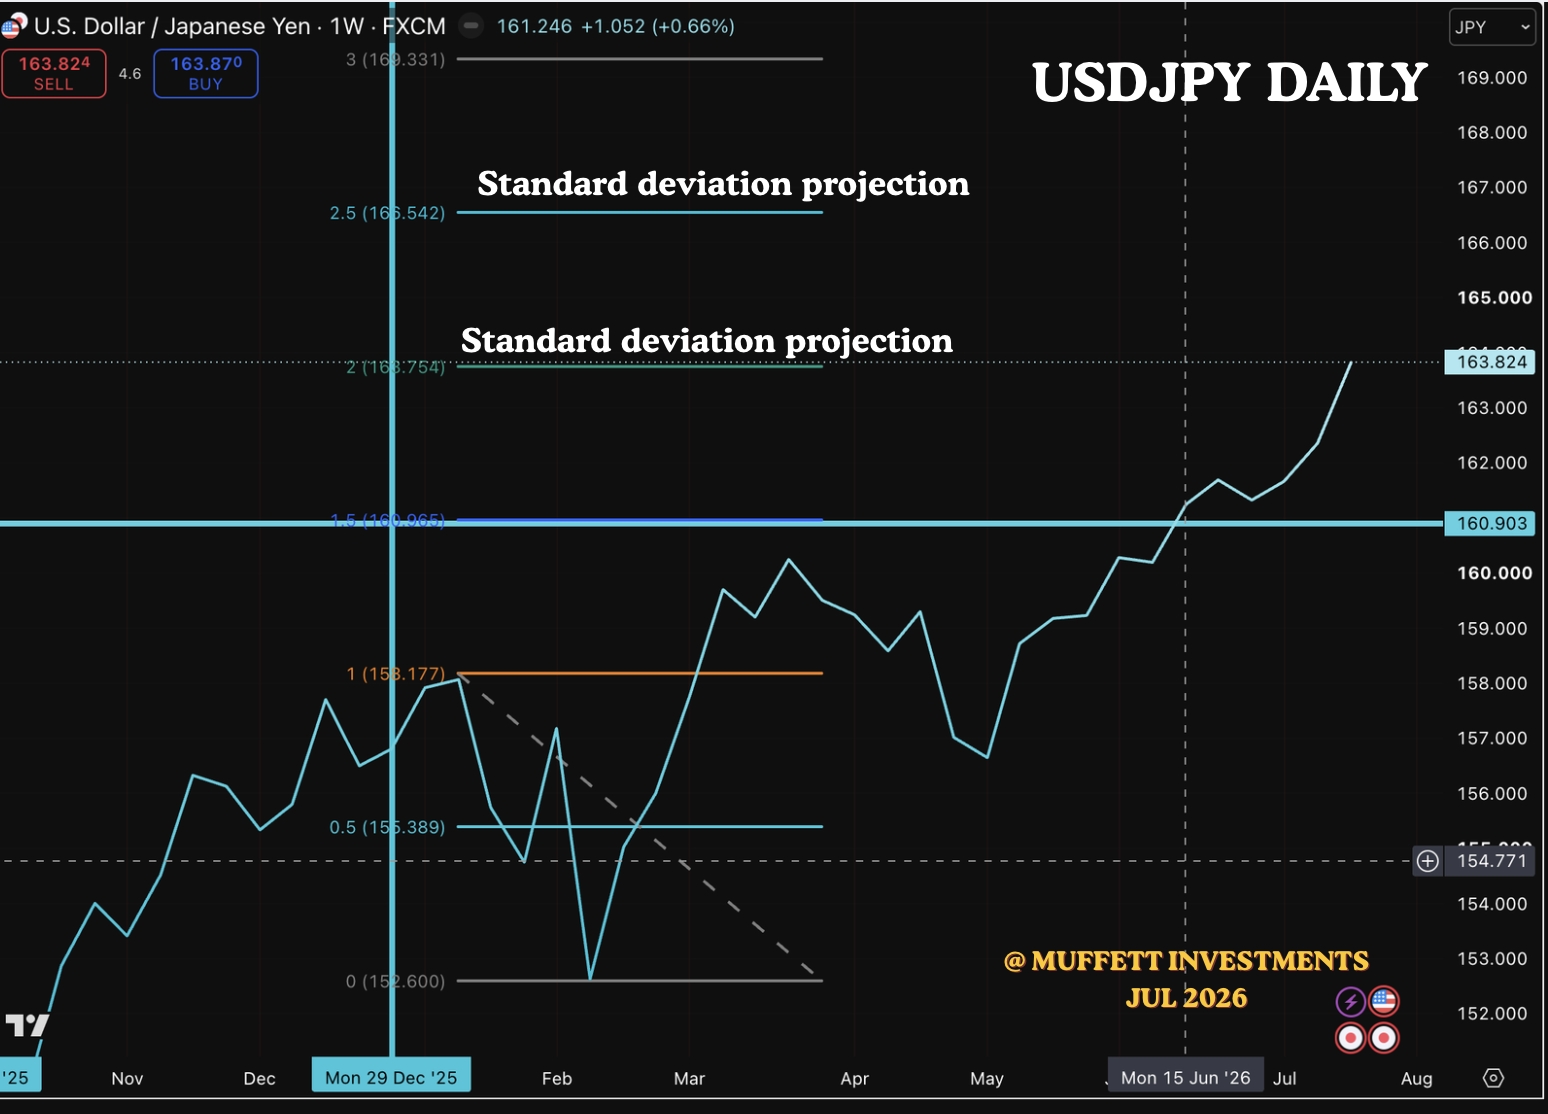
This is the daily chart of the USDJPY. Is it not strange that the price closed exactly at the standard deviation projection. Stranger things can happen and we need to be on gaurd when correlations change. Let me explain what i mean by this.
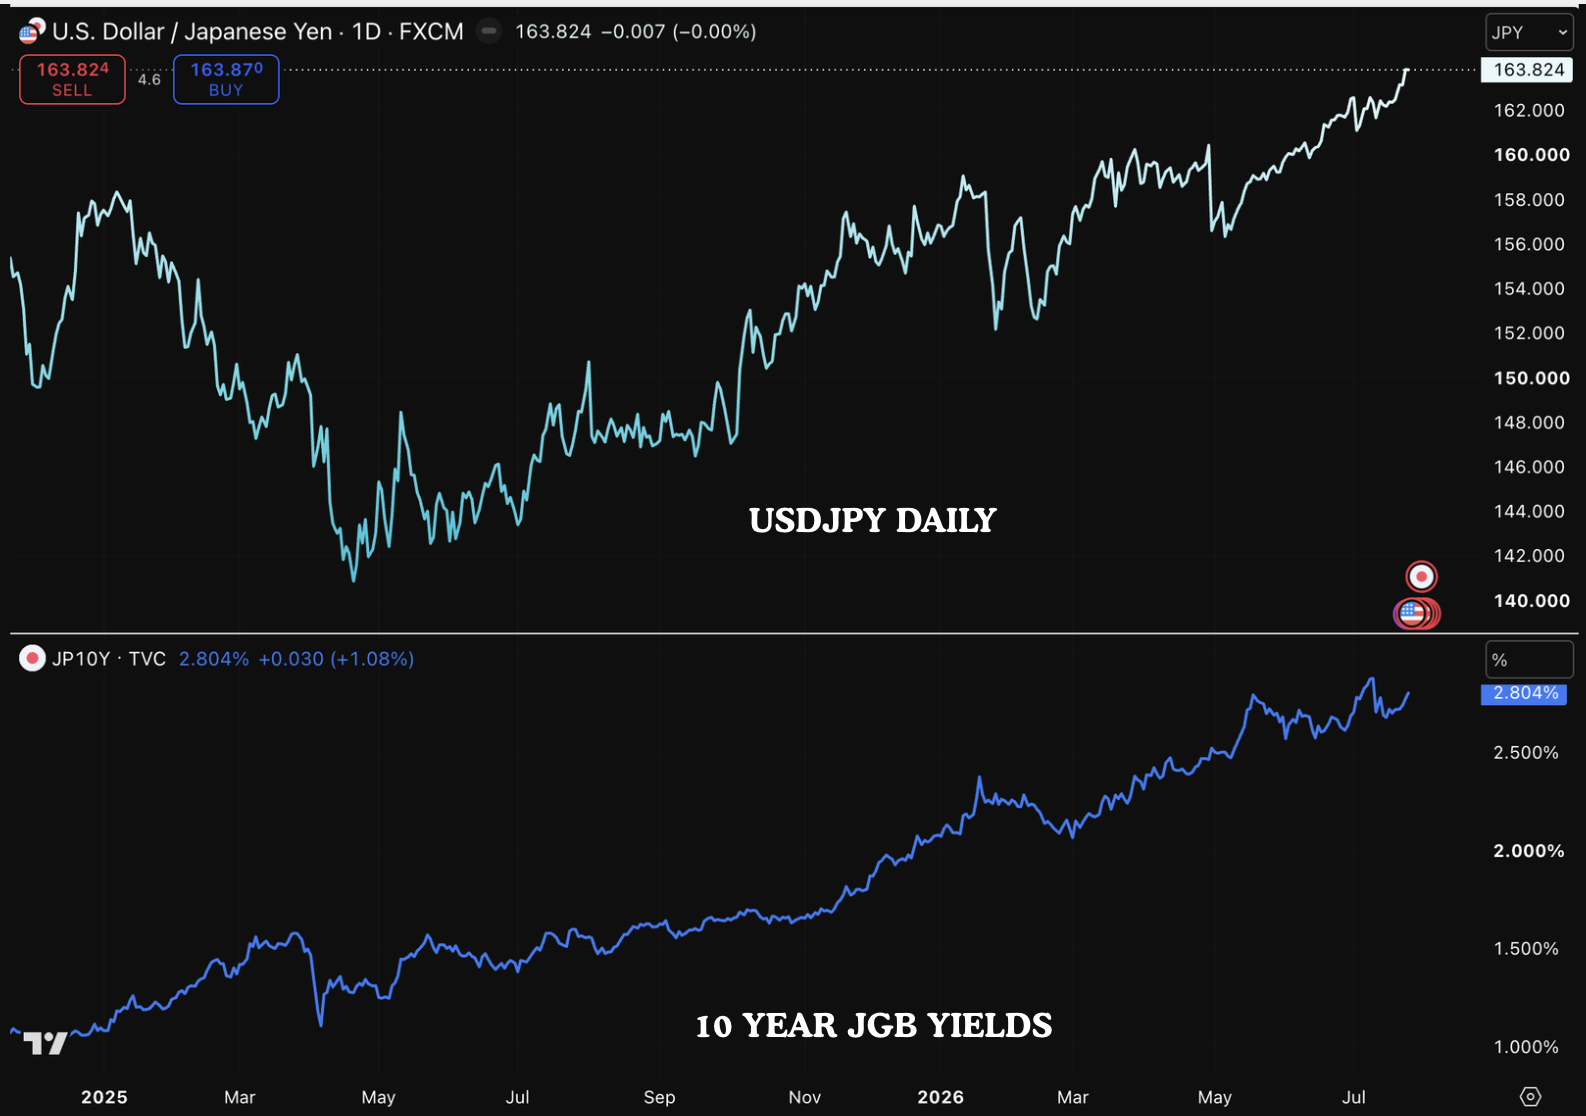
Earlier in the year, when we had the purge in the DXY, we were calling for higher USDJPY because there was a clear divergence between the DXY and USDJPY. DXY made lower lows but USDJPY were making higher lows. Many people on Linkedin were talking about how the USDJPY price would collapse due to rising japanes yields. We however stuck to our guns based on our algorithmic logic and we were proven right. It does not mean that the others are wrong. we have been wrong many times. The idea here is that established correlations can change with time, and we should be on guard to see the change. Otherwise we would be caught swimming naked when the tide goes down.
Analysis done in good faith and not investment advice.
May the Peace of the Lord be with you always.
