DXY roadmap: 6 months outlook using algorithmic concepts:
"We cannot predict the future, but we can price its probabilities." – Anonymous Trader
Today we are attempting to map the DXY path over 6 months based solely on 2 things
Algorithmic manipulation concepts and liquidity targets
A premise- What the US administration wants for the dollar.
First we will tackle the premise bit because a premise is a premise But clearly with its massive debt burden and trade deficit, the current US administration have a clear strategy which they have openly stated. They want the US dollar weaker so that US exports can become competitive and also the debt burden will fall if the dollar weakens. If they weaken the dollar aggressively, the capital will flee the US markets which they also dont want. So they will do it gradually. This is the premise we are working on and we will hold this until proven wrong.
we will now move on to the technical analysis bit of this report.
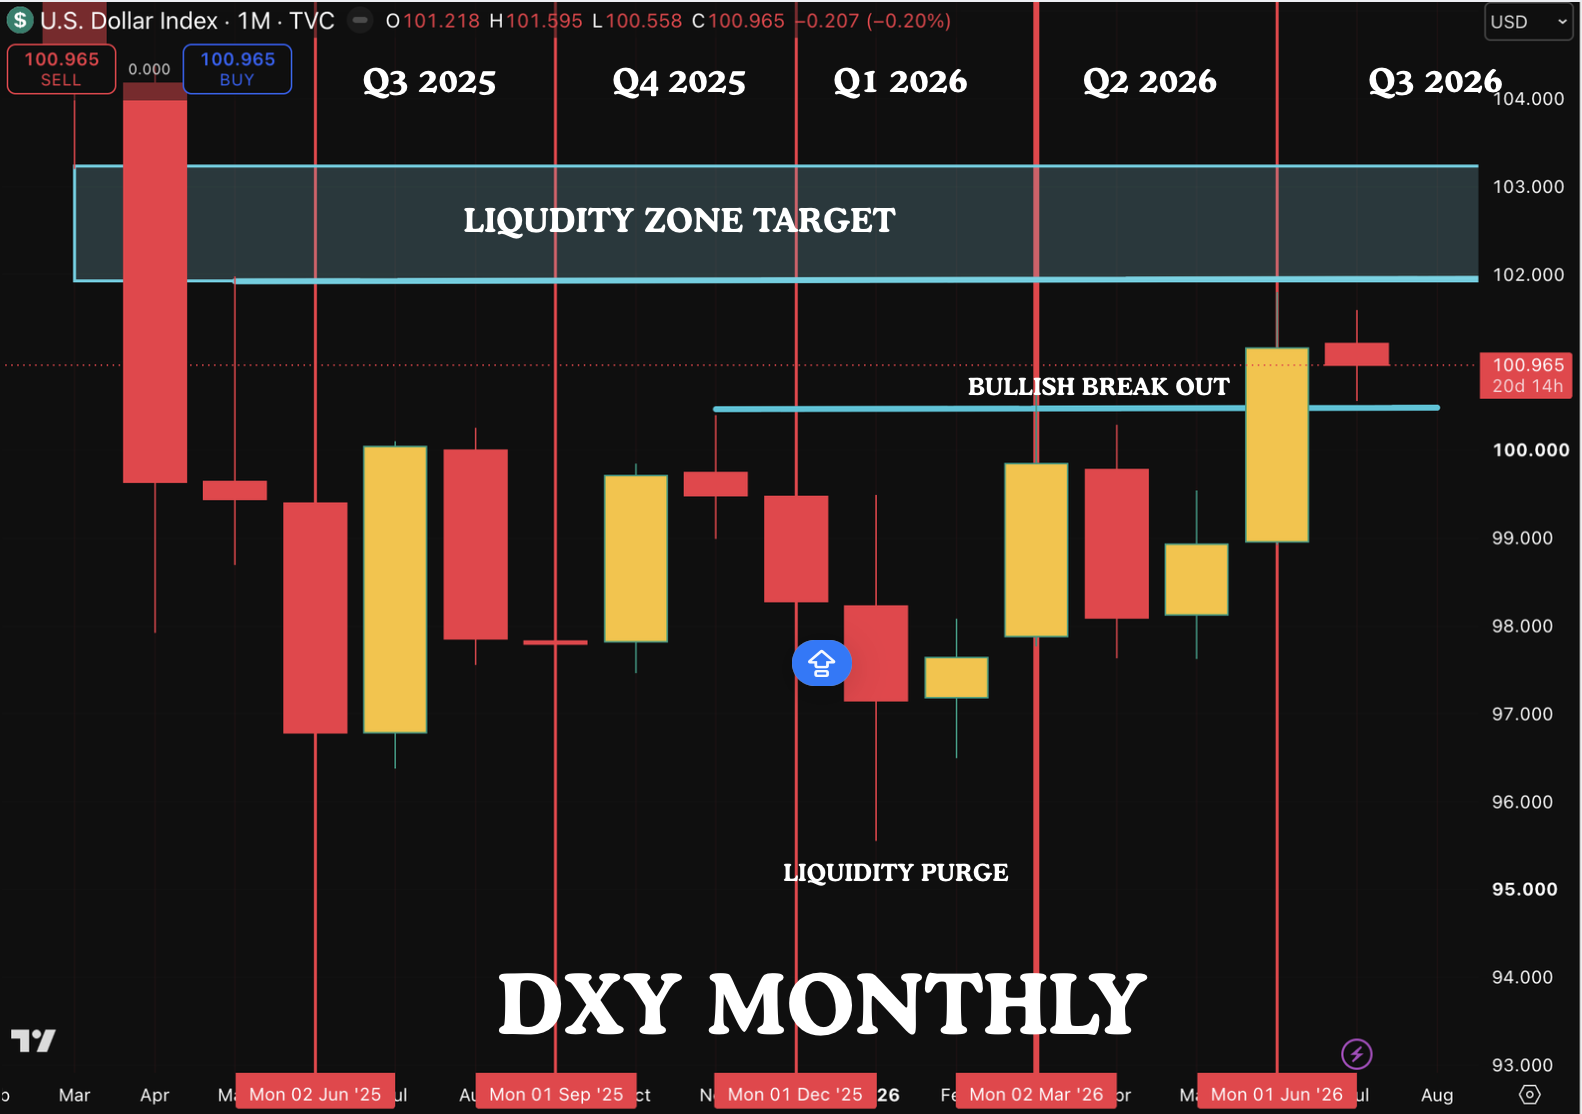
The above is the DXY monthly chart which perfectly illustrates that we have been in a range over the last 1 year. Prior to this, we had a big fall in the DXY within months of Trump taking office. As you can see in the chart, the price has now broken out of the consolidation in last months candle. As per the algorithmic rules, price goes from one side liquidity to the other side. The liquidity purge at the lows shows the sell side liquidity purge. Not the price has taken the buyside liquidity. But we do not have the purge yet.
So the most likely outcome would be the move into the liquidity zone drawn in blue. So until proven otherwise, a bullish bias should be had. The market structure will be broken on the daily chart, when price closes below 99.50. Until that happens all retracements in DXY should be used to taken shorts on EURUSD and GBPUSD. Please see previous analysis, we are expecting price to be supported at 100 and 99.80.
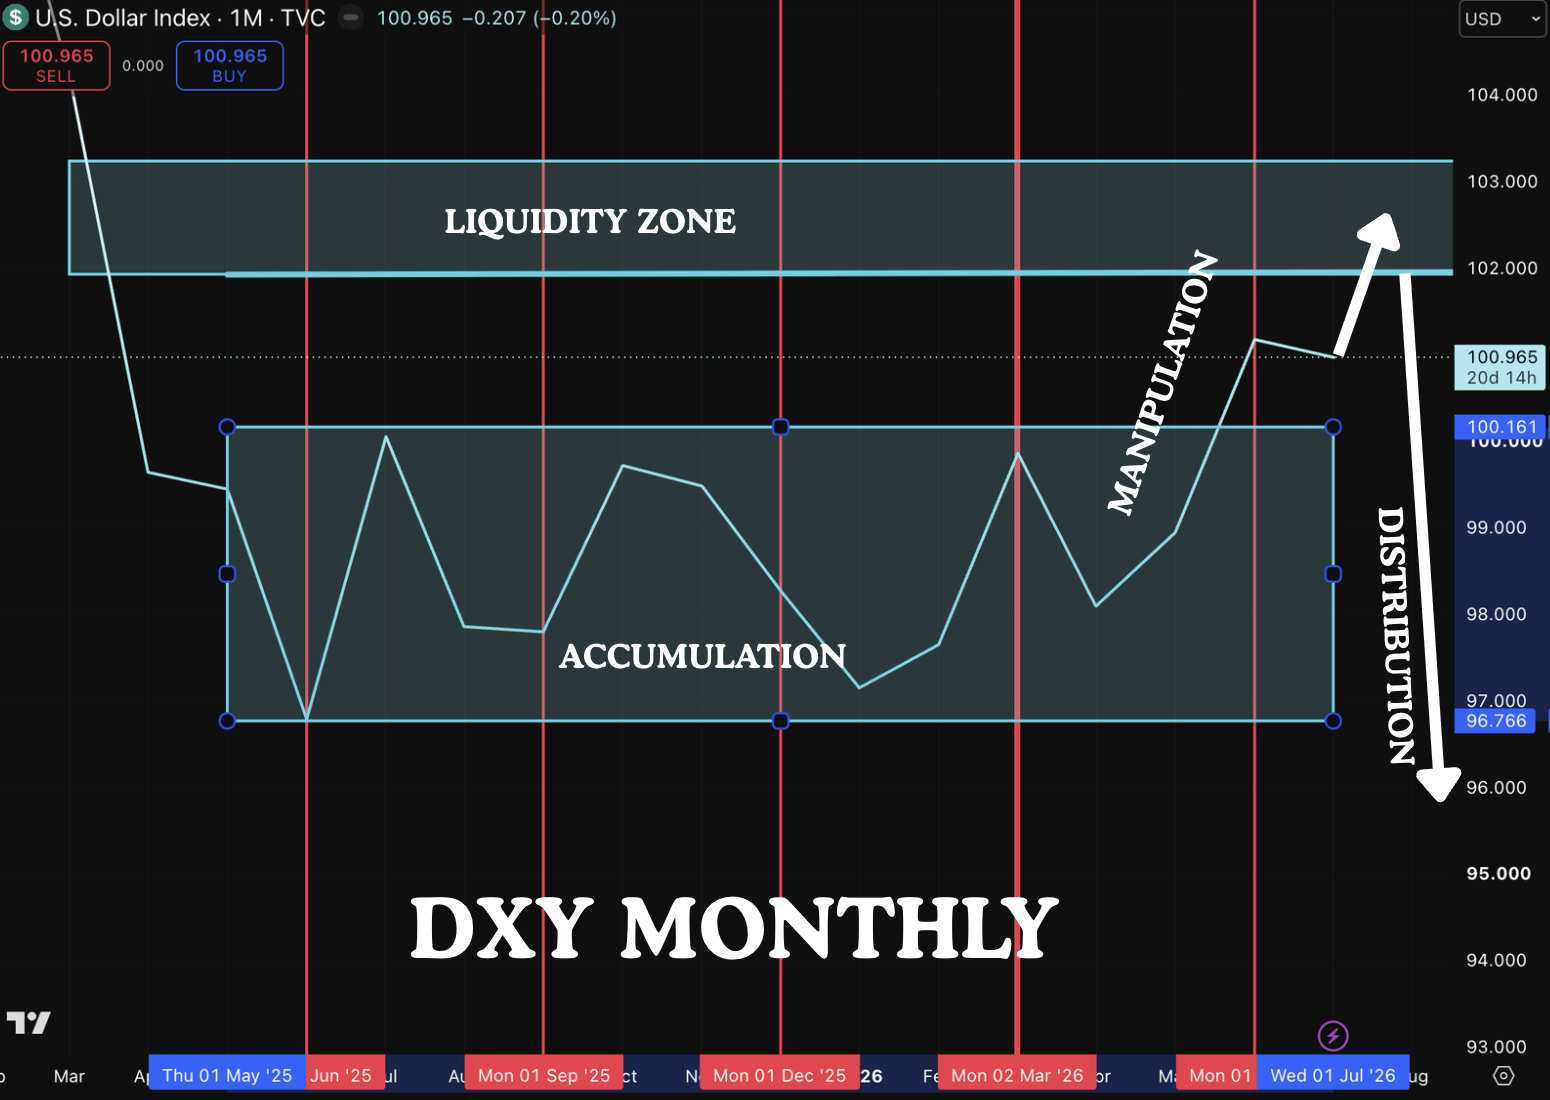
If you look at the line chart , this is likely to be a AMD (accumulation, manipulation and distribution) pattern. The idea here is that the breakout will make traders think that the dollar has broken out. They will move the market aggressively into the liquidity zone, and induce more and more traders to take long positions. This will also stop our intitutional shorts who have taken positions to hedge positions. Once this has been achieved, the price will be moved to the opposite side liquidity which is the lower range of the consolidation.
The timeframe for this trade would be about 3-6 months. If price goes to the liquidity zone, we will watching price action closely. Usually the price is held in consolidation just below the liqudity zone to create orders on both sides of consolidation and then the price moves aggressively stopping out the shorts and inducing longs and then price moves aggressively down trapping the longs. This is the liquidity purge. our idea would be confirmed if we have this purge.
If price continues higher and closes above the liquidity zone, then the DXY becomes bullish and our premise (Trump wants lower dollar) would be invalidated. Also if price closes below 99.50 on a dailly basis, then price structure becomes bearish and then we will be back in consolidation for the DXY in which case, we just remain on the sidelines.
Here we have not looked into any of the fundamentals or other factors into consideration and also external events in the future may change the US administrations views on the dollar. The current analysis relies solely on Algorithmic concepts and a premise. But it is still an useful tool and if you want an unbiased view, then we just stick to the algorithmic concepts.
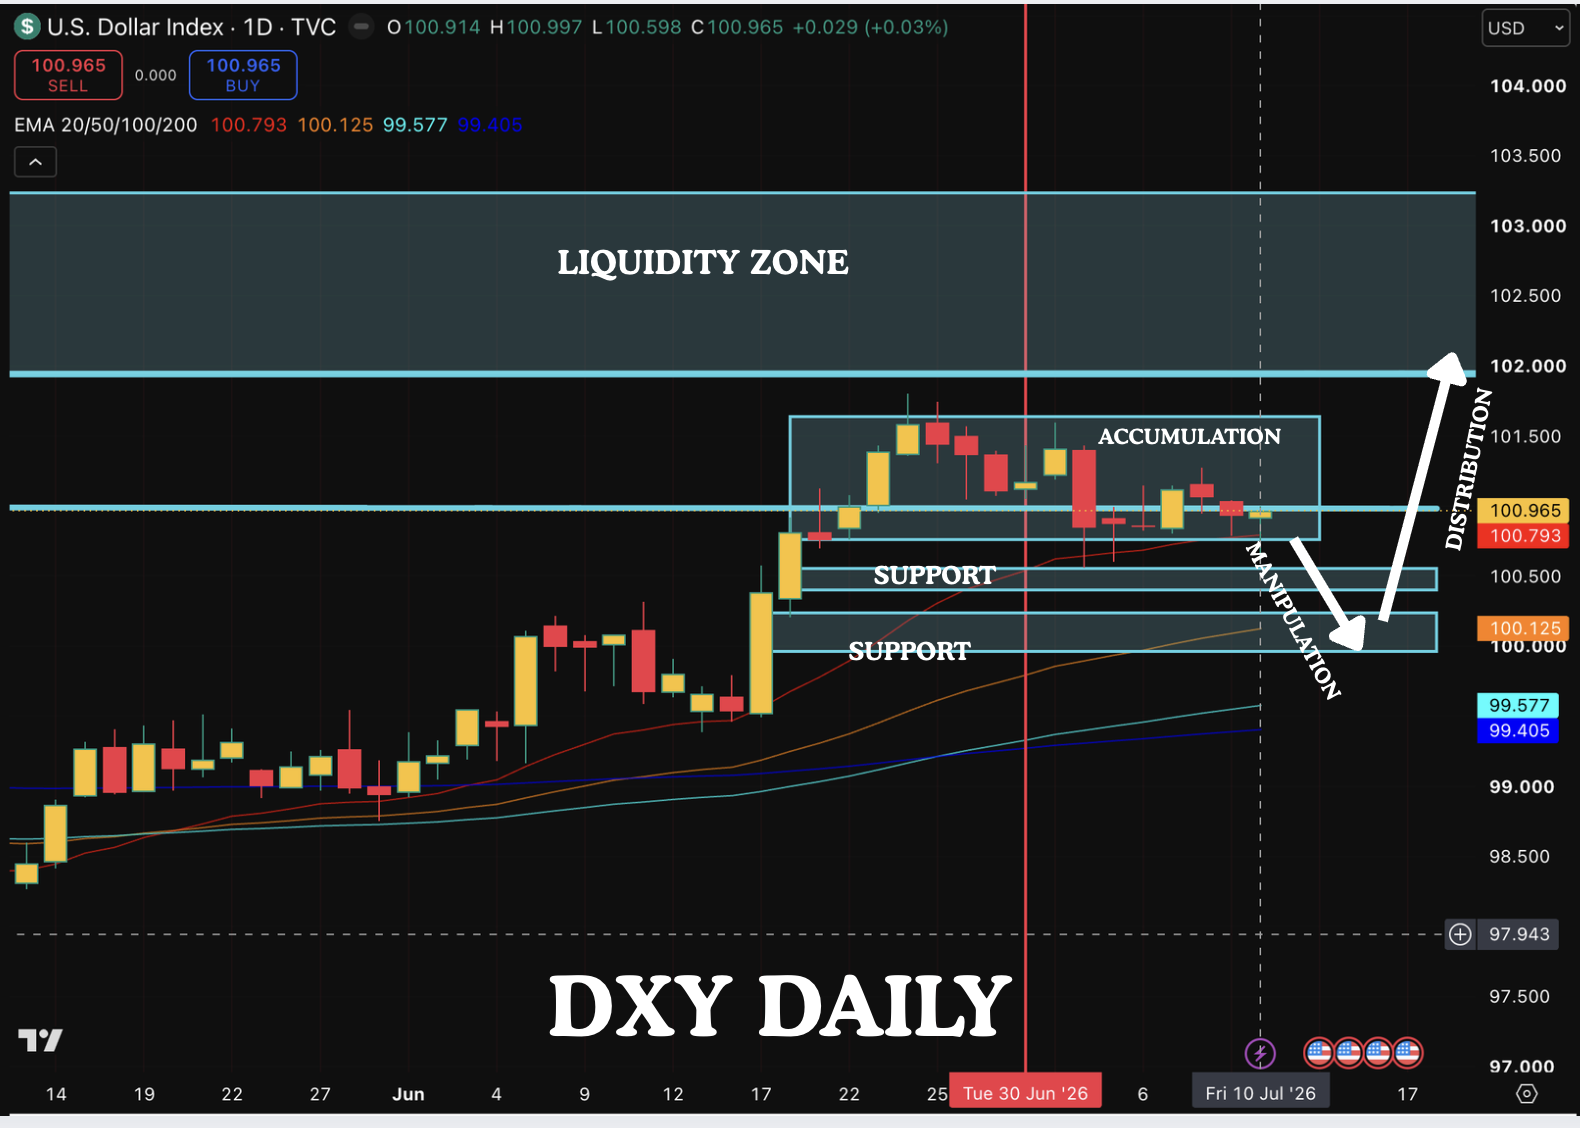
Here is the Daily chart of DXY. We can see that the price is in an uptrend with price above the moving averages. We are consolidating just below the liquidity zone. Our expectation is for a move down to one of the support zones followed by a move into the liquidity zone. If the price closes below the support, then it is very likely our expectations are wrong .
Again we are seeing the AMD pattern in the daily chart. These patterns occur in all timeframes if you spend the time to look for them in the lower timeframes.
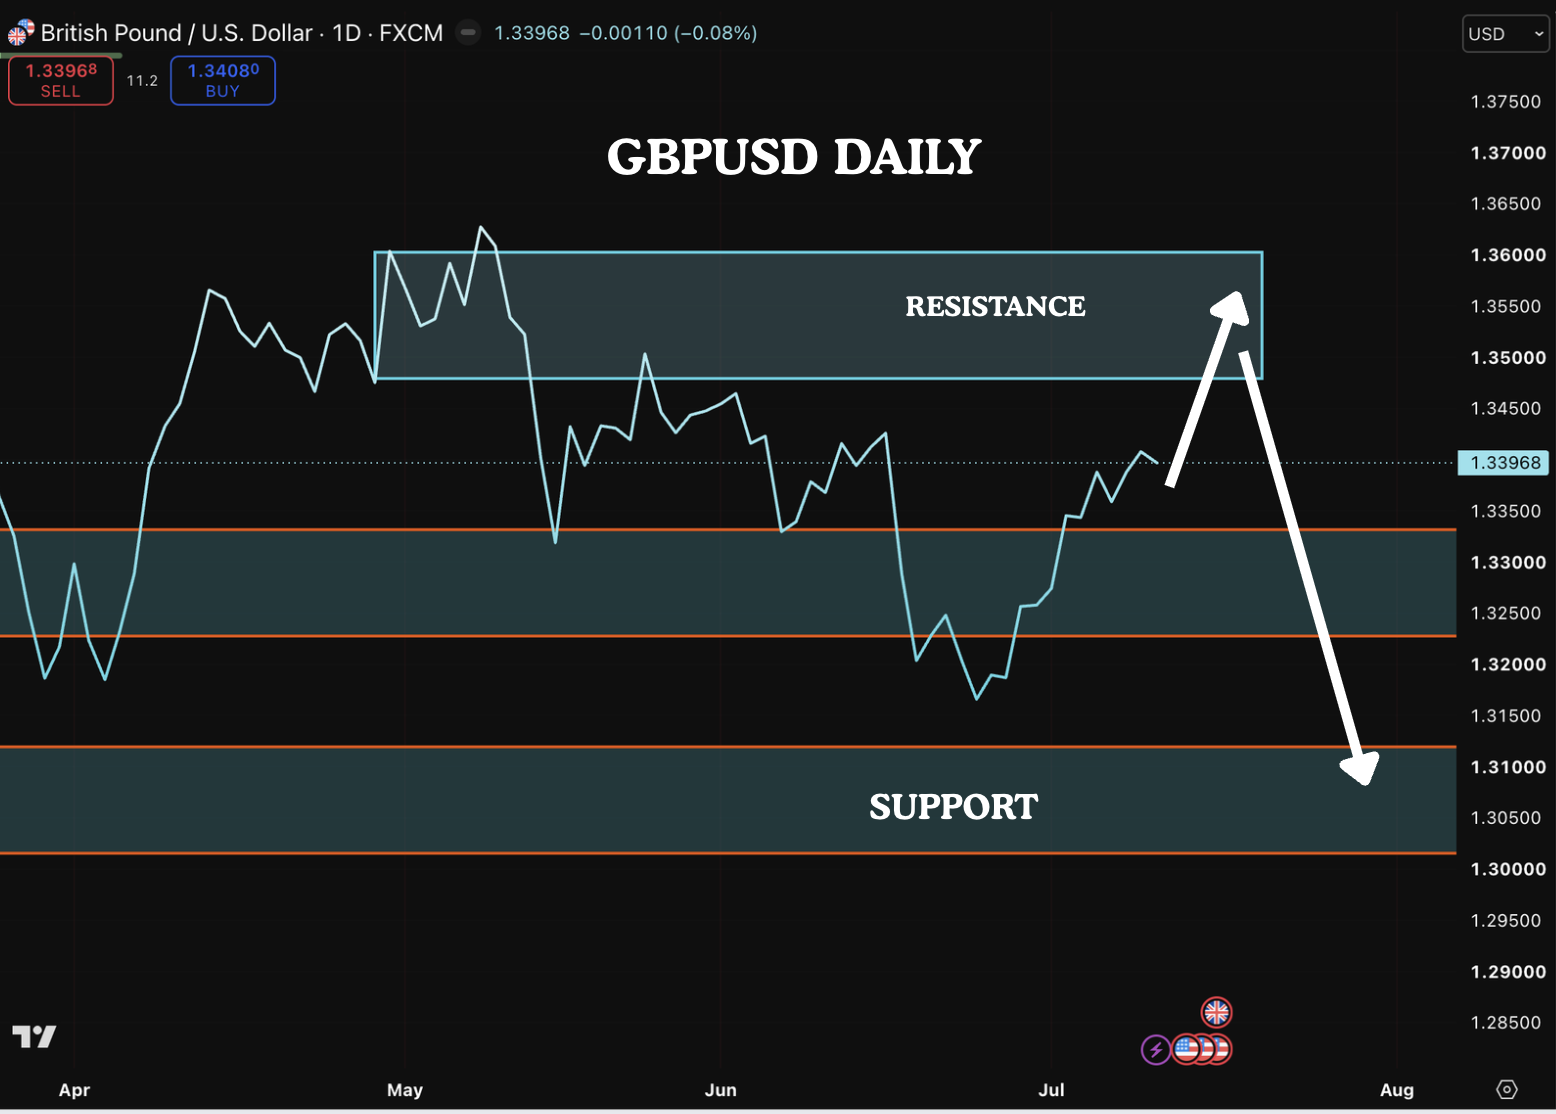
This is the daily chart of GBPUSD. Each week we will attempt to cover 1 currency pair. We think that ats the dollar falls, the price will test the resistance zone and as the DXY startes to move higher, we can see the GBPUSD show weakness and head to support.
This is our current view oft he market]
Analysis don ein good faith and not investment advice.
