Flowing with the tide- DXY review and outlooks
"There is a tide in the affairs of men, which, taken at the flood, leads on to fortune; omitted, all the voyage of their life is bound in shallows and in miseries." - Shakespeare
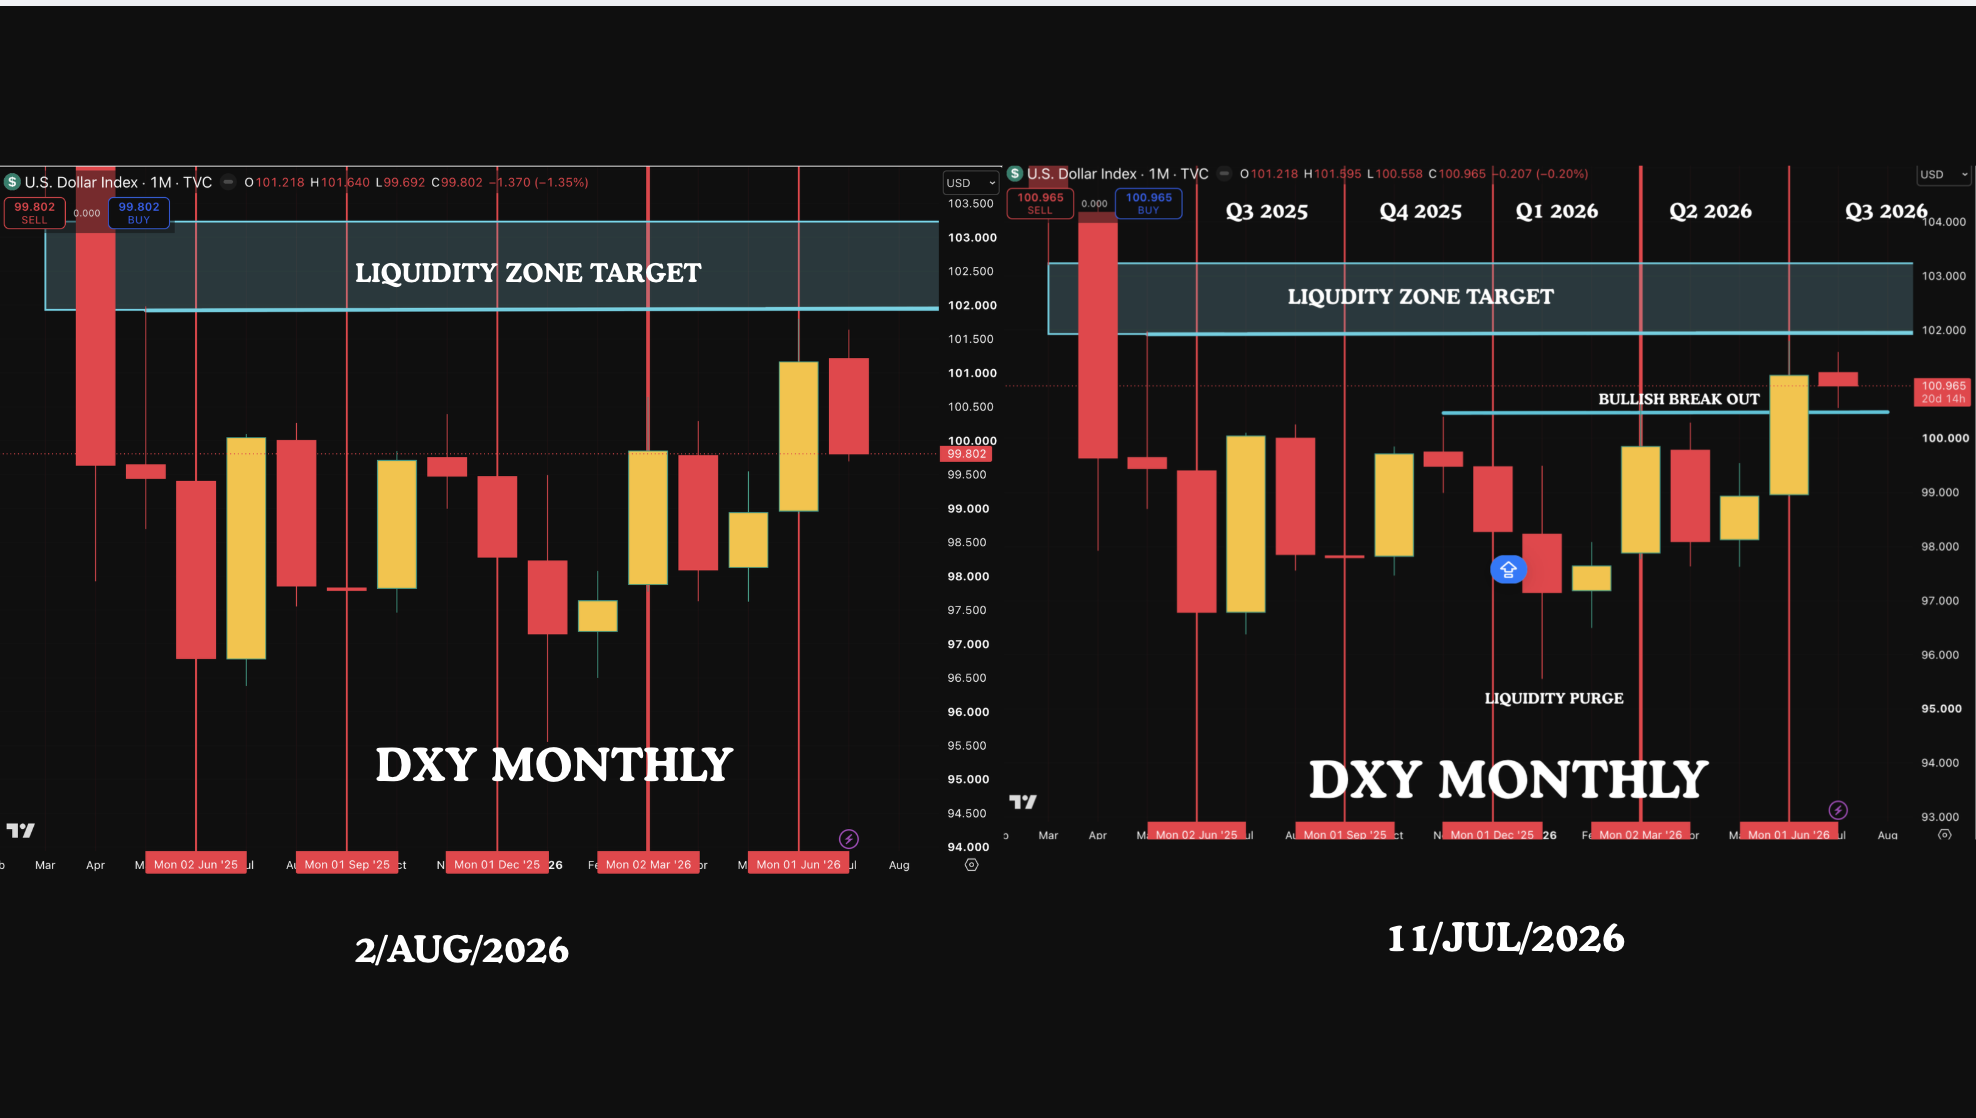
Key message is to go with the tide (as much as possible). Then we will be rewarded. There may however be times where our Risk Vs Reward and conviction makes us swim against the tide. On the matter of DXY we are going to swim with the tide. we want you to kindly refer to previous analysis but in particular our 6 month road map for context. https://www.muffettinvestments.com/dxy-forex-analysis/dxy-roadmap-6-months-outlook-using-algorithmic-concepts
The chart above is the monthly chart screenshot of DXY at 2 different dates shown in the chart. One chart is bullish and the second chart is bearish. So on the 11th of july, the DXY chart looked primed to go into the liquidity zone. We were looking for price to go there into the liquidity zone and then may be look for weakness. But when we look at the chart today we can see the candle close bearish. Until price can go above the opening price of this red candle which is 101.23.
There is however one thing that bothers us. The price was so close to the liquidity zone and then price was aggressively moved down. This is clearly manipulation particularly in the USDJPY pair. The last time this happened we turned bearish again and looking for USDJPY liquidity to be taken but the price continued higher. We are bearish again this time as we follow our own analysis framework. But there may be a chance that at a later stage price will be taken back into the liquidity zone. We have to keep this in the back of the mind as it is very suspicious when price action happens like this close to a liquidity zone. But for the now, we will be looking for lower time opportunities for USDJPY shorts and AUDUSD longs.
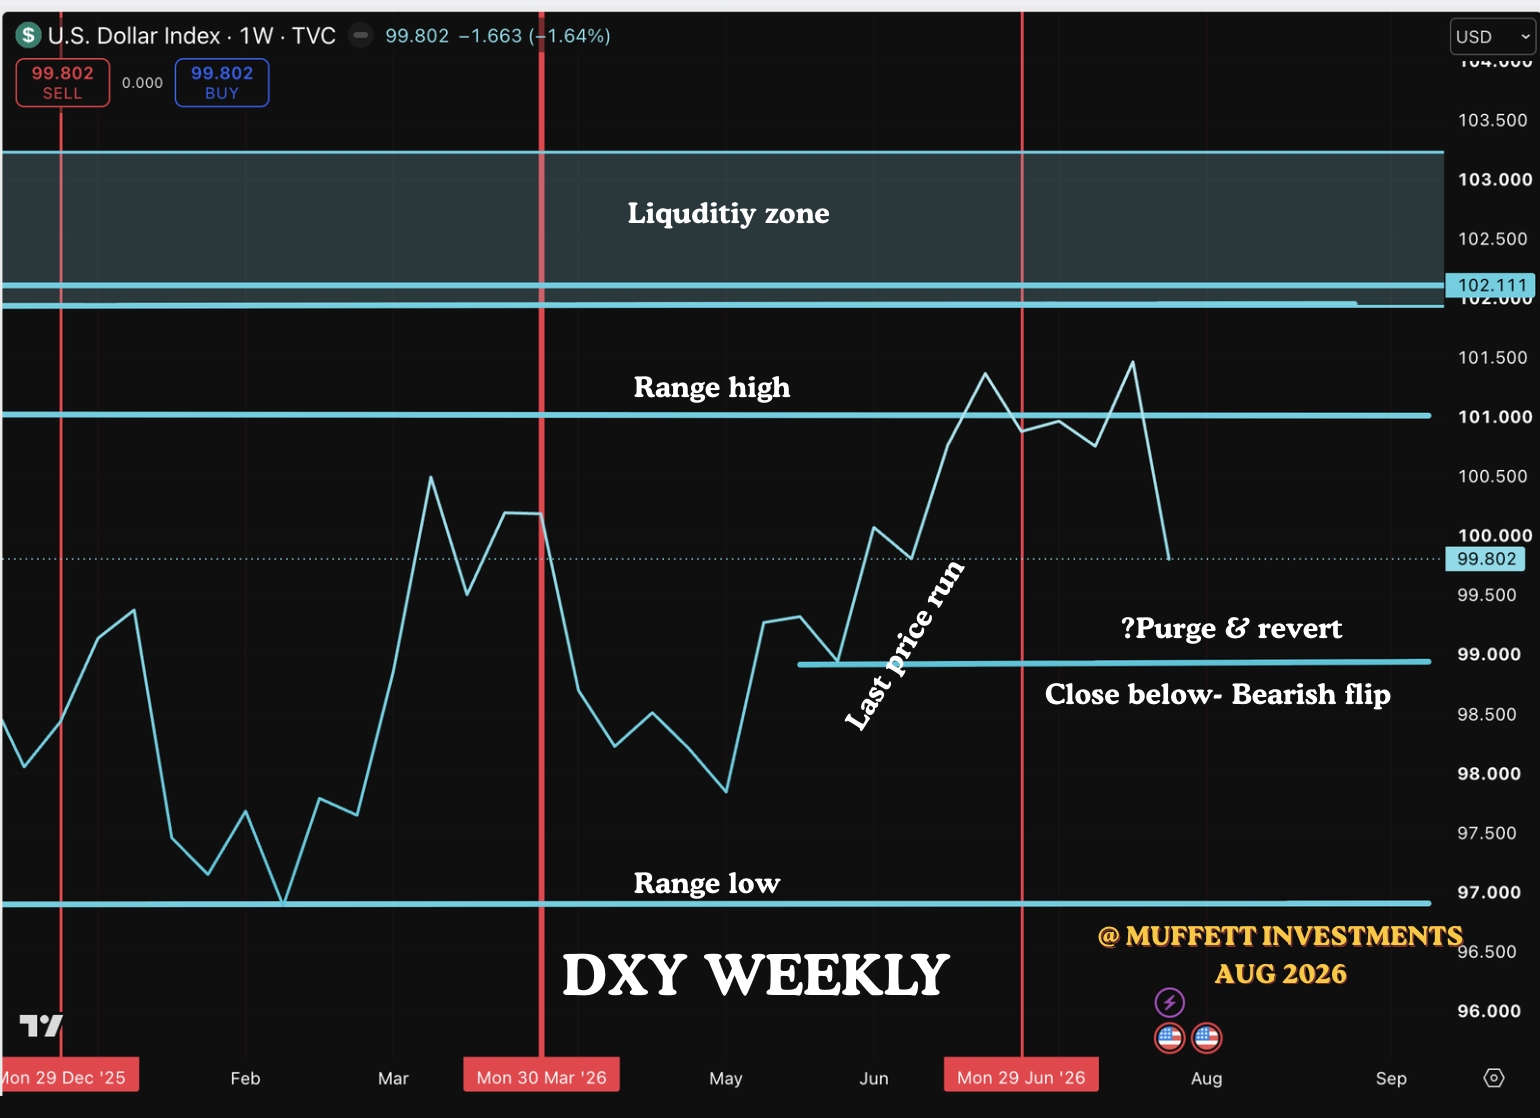
This is the weekly chart. We have the range high and range low and during Q2 2026, price made a run higher and took out the liquidity of the range high. As price was in close proximity to the liquidity zone, we were looking for continued move higher. The price has now closed below the range high and based on our previous paragraph above, we give the bullish view a small chance. we will watch what happens around 98.93 line. If price purges and reverts here, then a move to the liquidity zone is still possible. However a clear close below would make us bearish and we will look for a move down to the range low. This is what the Trump administration would want.
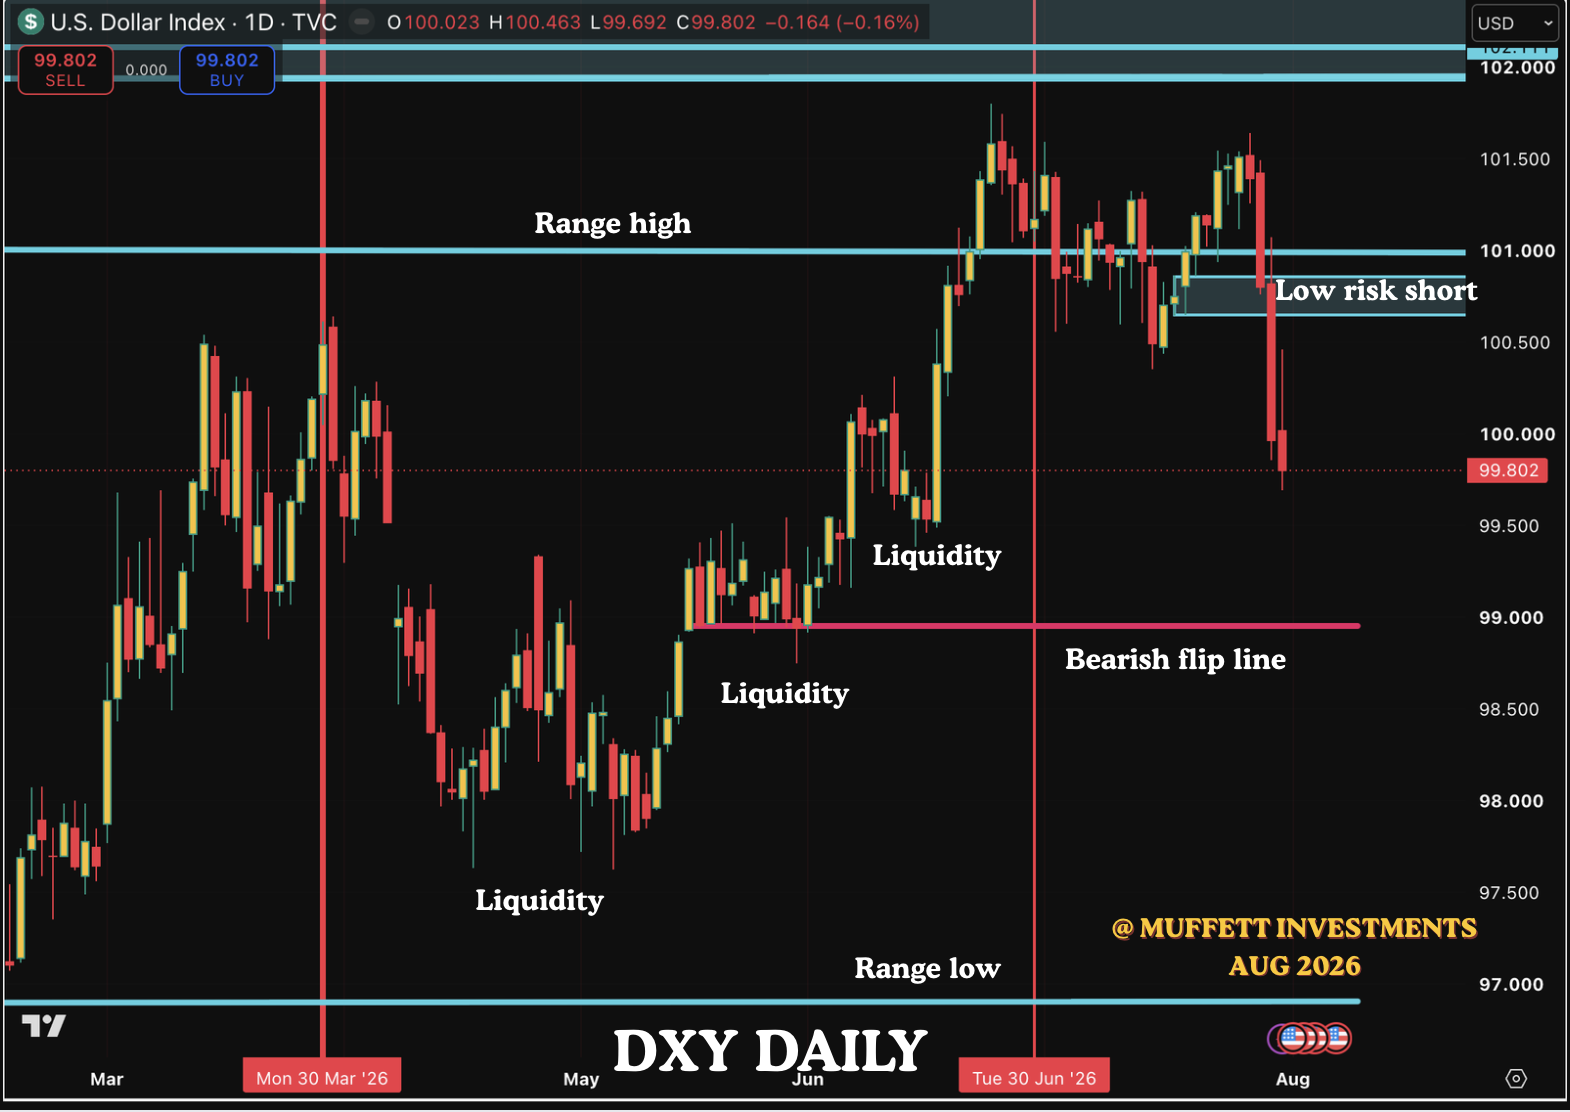
The daily chart view of the DXY. We have marked the zone which would be the best place to take shorts on DXY. Particularly on USDJPY when DXY comes there. if this scenario happens, we will take shorts on USDJPY. At current levels, the risk vs reward is not there to take shorts on USDJPY. It is often the case that in the forex market price makes deep retracements against the current trend. so we may have a deep retracement of the bullish move on the daily chart and a deep retracement of the bearish move on the 4 hour chart. We have to choose the best places to play and this is the only advantage we have. A clear framework with managed risk is the edge.
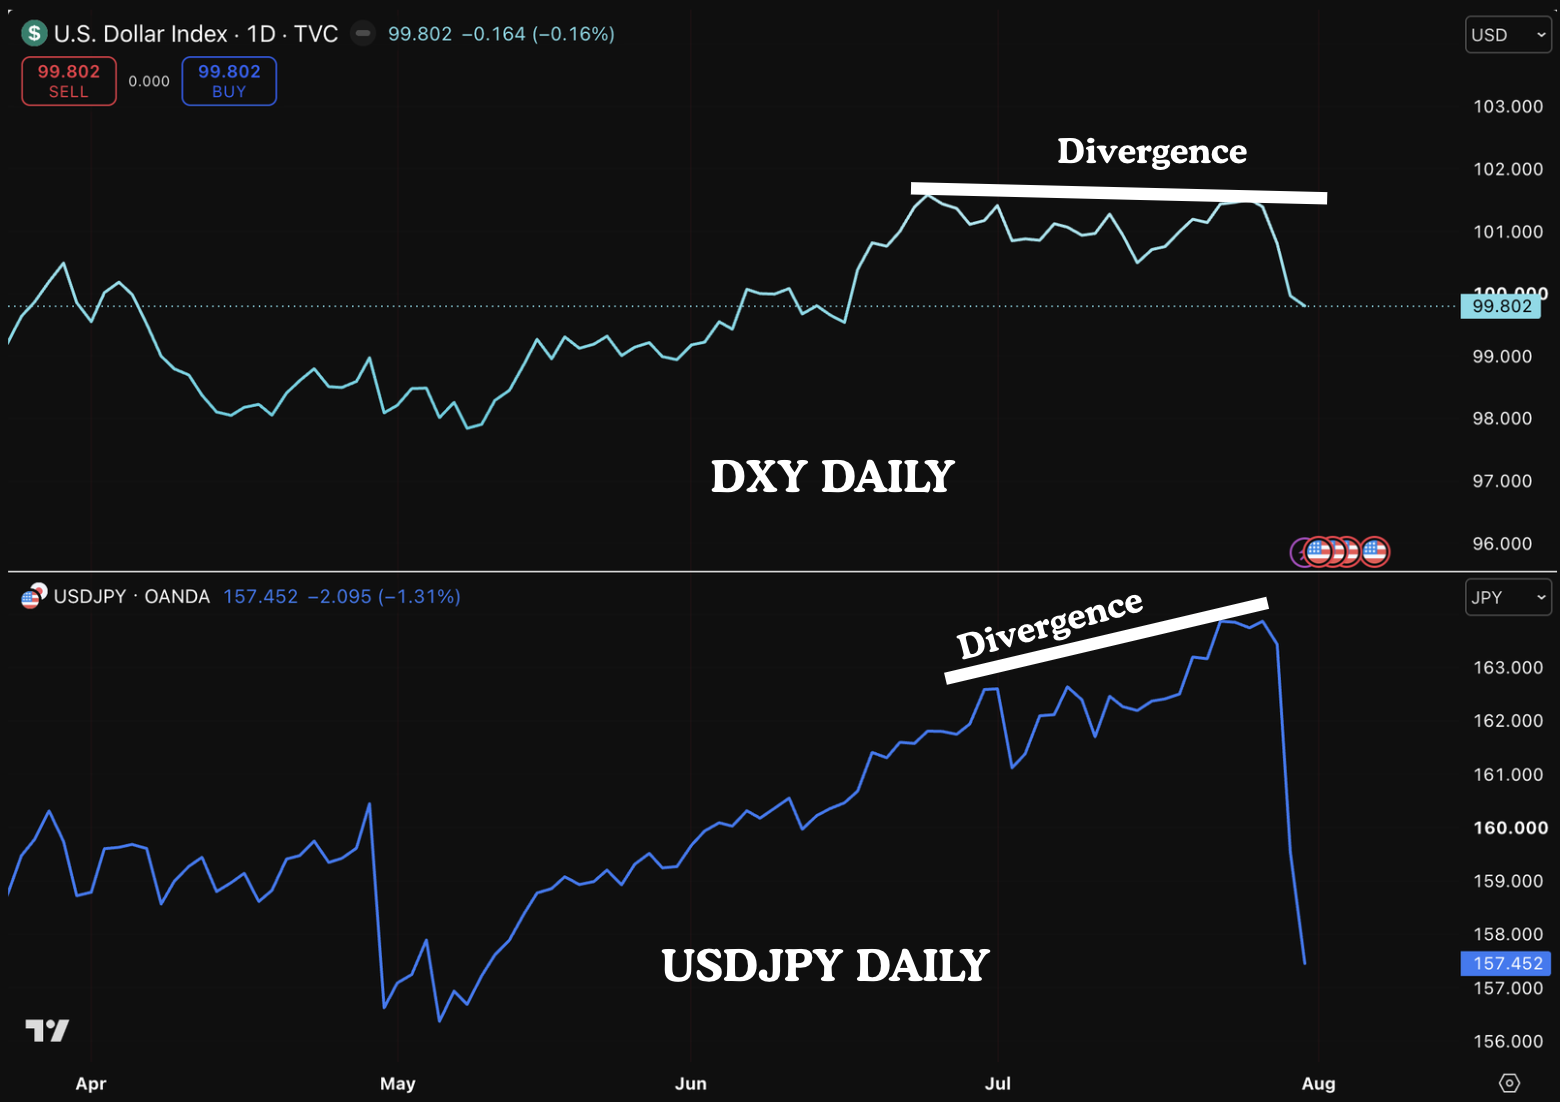
A bear case of DXY is this divergence we see above the ranges after the liquidity was taken. The DXY was making lower highs while USDJPY was making higher highs and since we were biased on a move to the liquidity zone we failed to spot this divergence. When the divergence is accompanied by price action, then most of the time some form of liquidity will be taken. And so we are reasonably confident that at least one level of liquidity shown on the daily chart of DXY would be taken.
What happens at 98.96 will determine the outlook for the currencies.
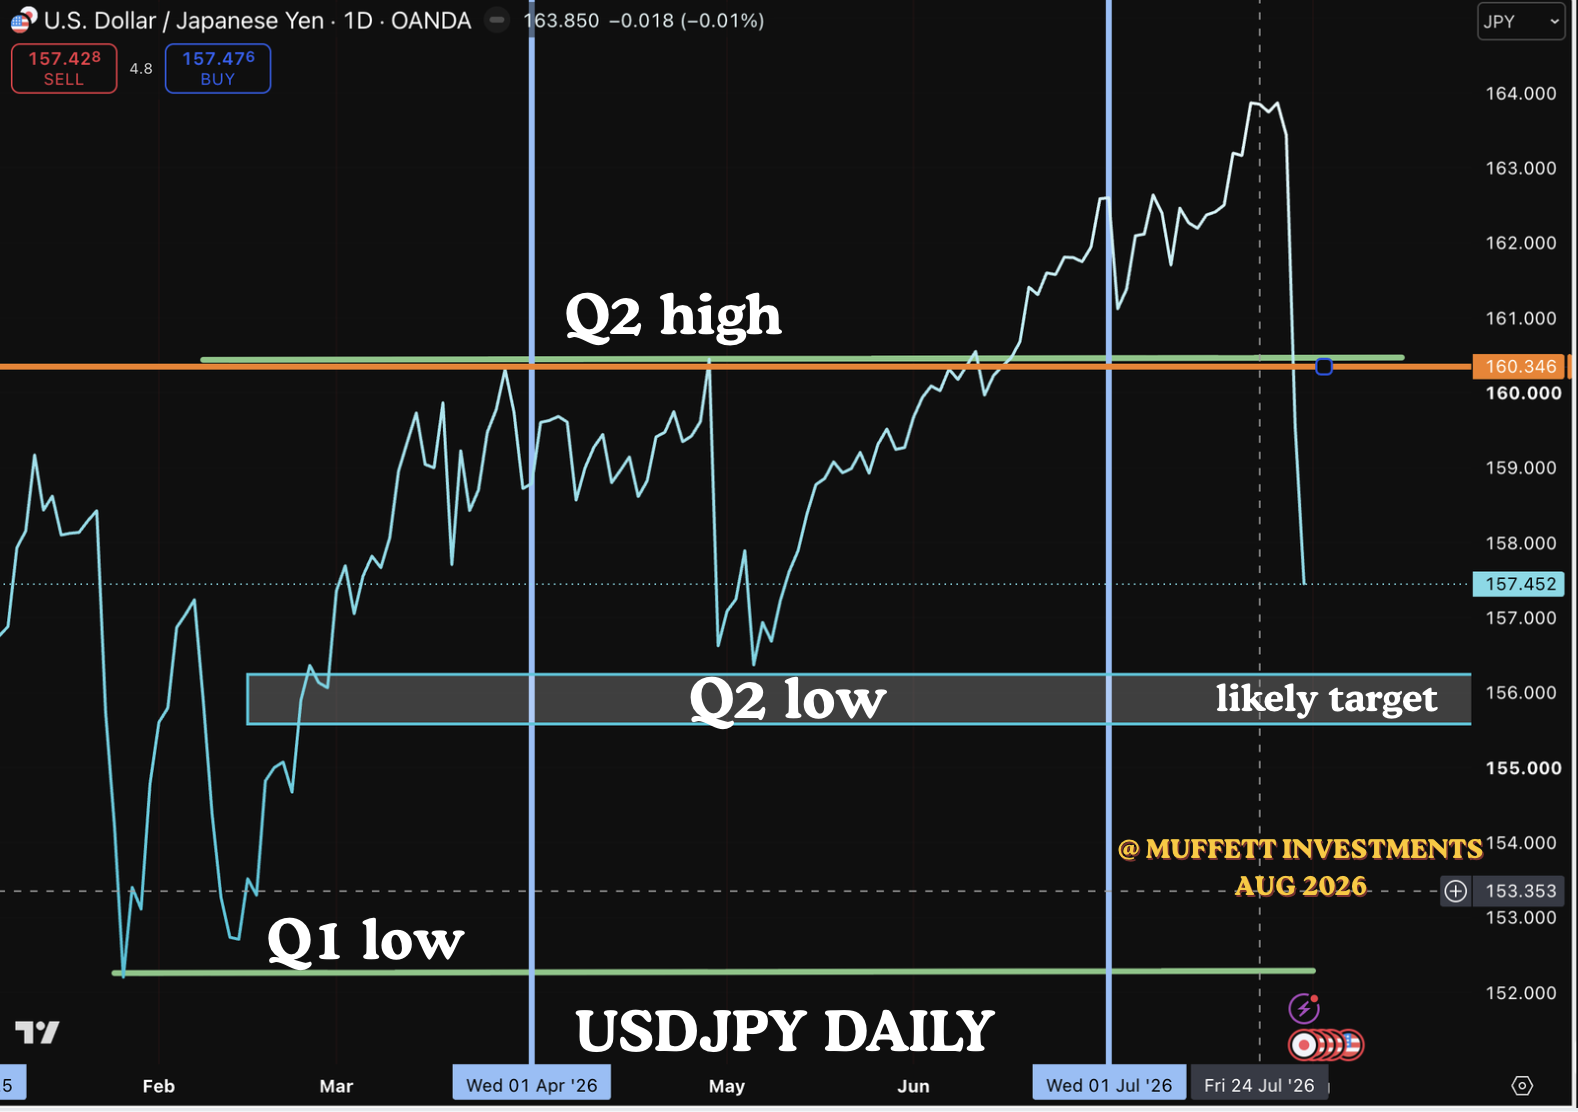
In our last analysis we were bullish but price action has proved us wrong. We said that price should not close below the 1990 high on a monthly basis. we have indeed closed below the high and because of the divergence we saw at the top, the most likely target would be the Q2 low and if DXY loses support of the bearish flip level, the price can take the liquidity of the Q1 low. We have to see what happens at the Q2 low. If we have a purge and DXY finds support then price is likely to head higher again and the current move would be considered as a liquidity run. If the price clearly closes below the Q2 low on a daily basis, then we are likely to see the Q1 low targetted.
Now this does not mean that we can go out and sell USDJPY on monday. We want price to retrace to resistance and then we can look to take shorts. If we see a potential short trade we will do a blog on it.
All analysis is only for educational purposes and not investment advice.
May the Lord God Bless you and keep you.
