Using market maker models to determine price moves and be on the right side of the market:
Published by Muffett Investments 12· June 2026
A significant portion of market moves are price moves to find liquidity — and once you understand that, charts start telling a completely different story.
What You're Actually Looking At
Most retail traders look at a sharp drop and see panic. They see news, fear, and chaos. What the Market Maker Model teaches us to see is something far more deliberate: a hunt for liquidity. The chart below shows the NASDAQ 100 on a 1-hour timeframe. It looks violent. It looks random. It is neither. The move is a planned move to engineer liquidity and to take out liquidity in a preplanned move
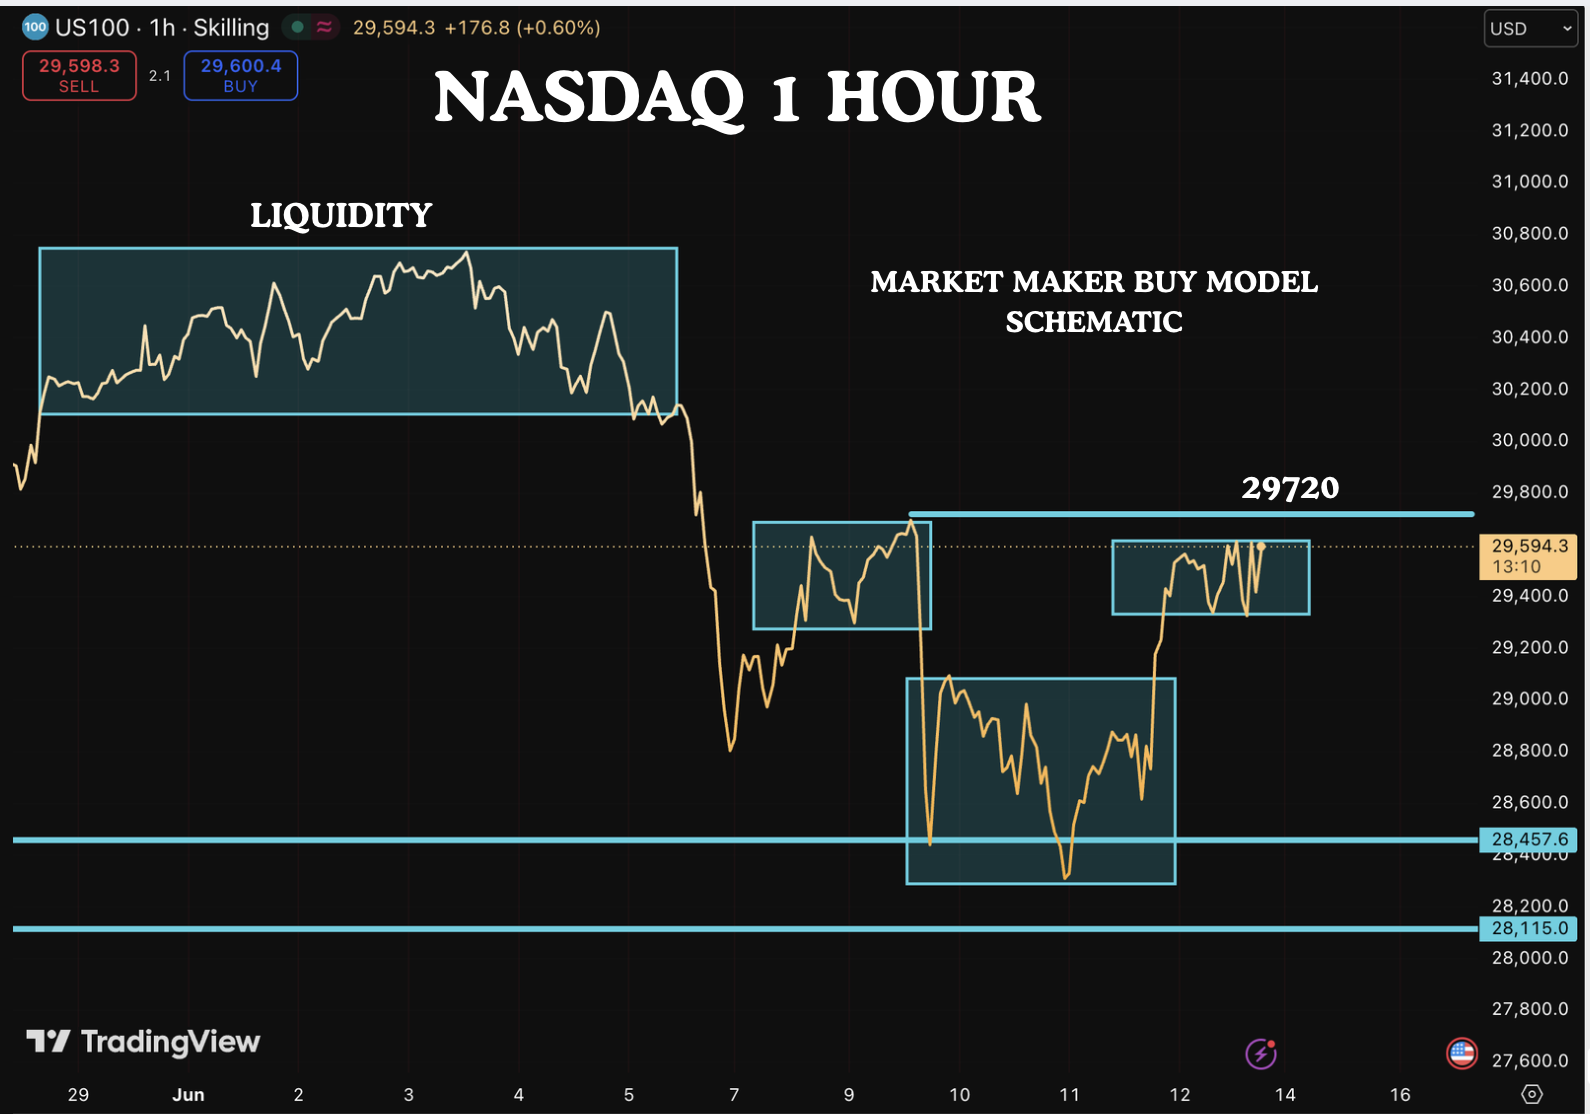
NASDAQ 1H — Market Maker Buy Model Schematic
Let's break down exactly what happened — step by step.
Step 1: Accumulation at the Top (Engineering Buyside Liquidity)
Before the big drop, price was consolidating in a clear range between approximately 30,200 and 30,800.
When ever you see consolidation it usually means price is being accumulated. There is back and forth movement trapping retail positions. This is accumulation.
During this phase, large institutional players — market makers — are quietly building short positions. Every time retail traders buy the range highs, the market maker is on the other side of that trade, selling.
The retail herd sees a ranging market and thinks: "Price is consolidating, it's going to break out to the upside."
The market maker knows exactly where the real target is: below — where all the stop-losses are sitting.
Step 2: The Liquidity Hunt (The Big Move Down)
Once enough positions were accumulated, price was moved aggressively lower. This is a controlled, deliberate push into a predetermined liquidity pool. If you have been following us, you would have seen us marking out the liquidity areas. Although we know where the liquidity resides, we do not know which liquidity is being targetted. Only the market makers know which liquidity pool is going to raided before price reverses. Our job is to identify the liquidity pools and then we look for signs of reversal
Think about it this way: below every consolidation range, retail traders place their stop-losses. Those stops are buy orders waiting to be triggered. They are liquidity — the fuel the market maker needs to fill their opposing positions.
The Nasdaq dropped sharply into the 28,400–28,500 zone. This area is exactly where the maximum concentration of retail stop-losses sat.
This is the sell-side liquidity grab.
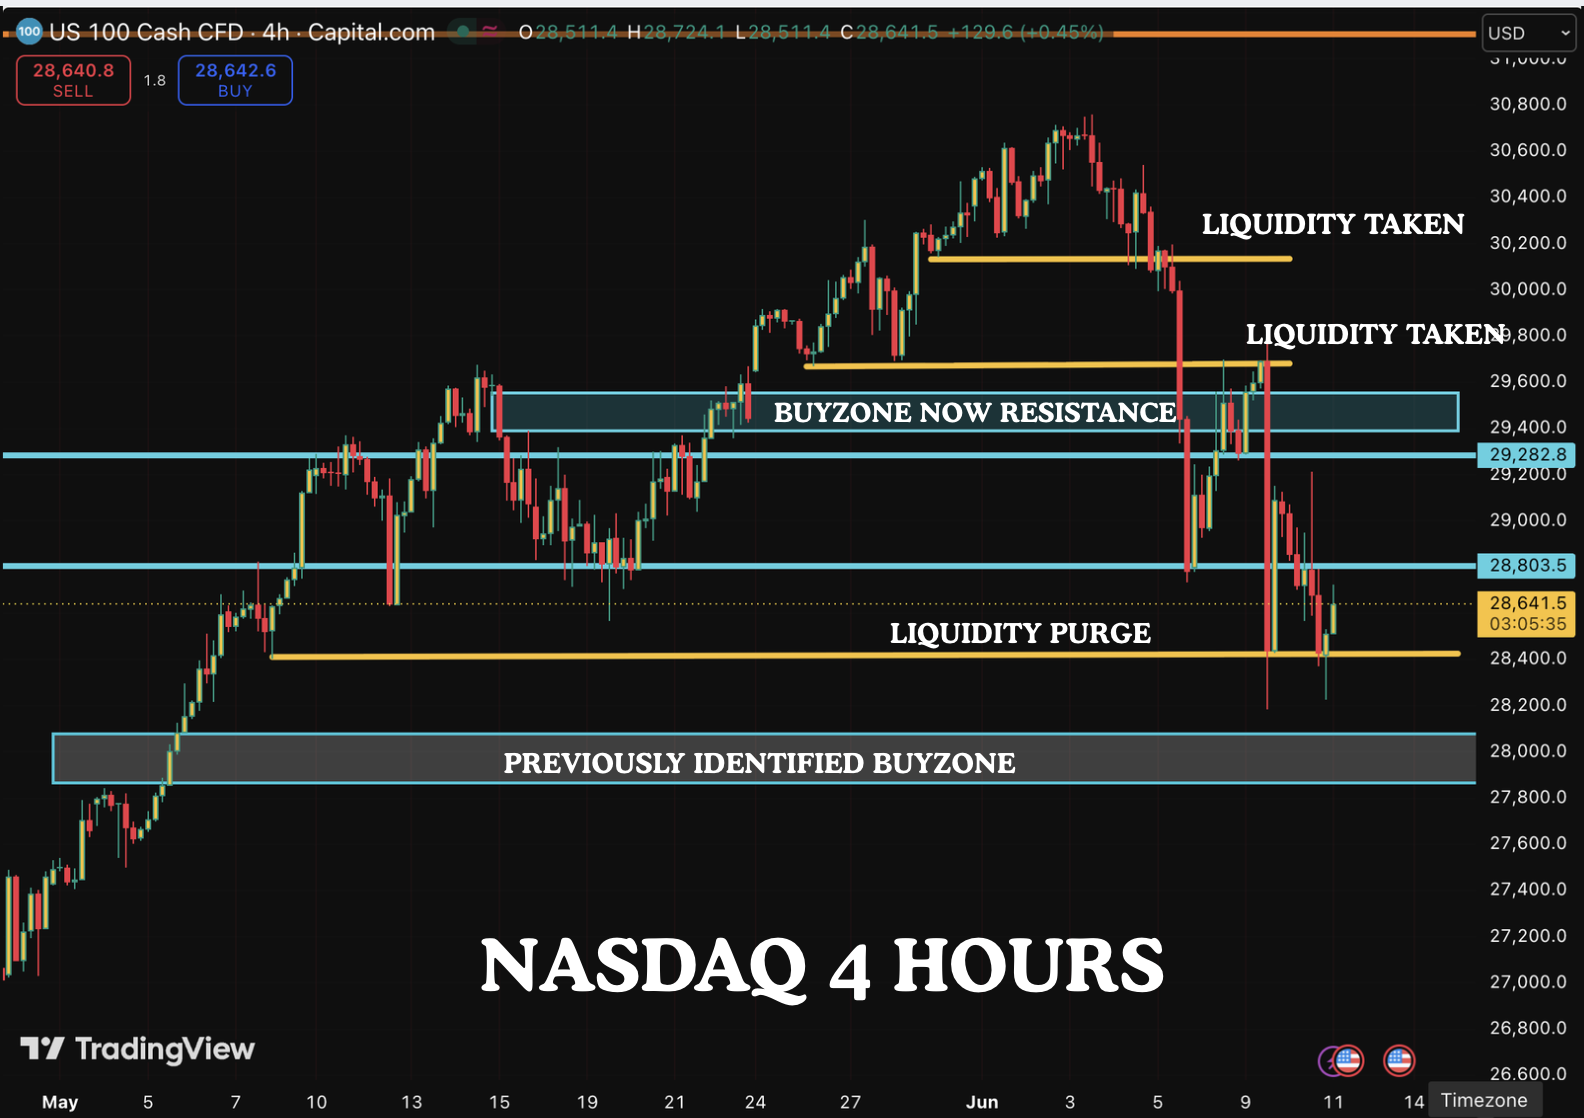
A previously shared analysis on Nasdaq showing how we marked liquidity areas.
Step 3: Accumulation on the Buy Side (The Real Setup)
Here is where the Market Maker Model becomes truly elegant. After raiding the sell-side liquidity, price doesn't simply collapse. Instead, it begins building new accumulation zones on the buy side — almost at mirror levels to where the sell-side consolidation occurred.
Look at the chart again. You can see two clearly defined teal boxes forming on the right side. These are buy-side accumulation structures: areas where the market maker is now flipping to long, absorbing every retail seller who thinks the market is crashing.
The retail narrative at this point: "The Nasdaq is broken. Sell everything."
The institutional reality: they are loading long positions.
The Key Level: 29,720
There is one price level that changes everything right now.
29,720.
This is marked clearly on the chart for a reason. It represents the old liquidity zone — the area where the previous consolidation was sitting before the drop.
If the Nasdaq breaks and holds above 29,720, it will signal one thing with reasonable confidence ,Price is now targeting the buy-side liquidity at the top — the highs of the original consolidation range and beyond. Why? Because above 29,720 sits a cluster of stop-losses from every trader who shorted the breakdown. Those stops are buy orders — and the market maker will run price directly into them. We will be watching closely today to see if we can close above 29720.
The Target: ~33,000
Our final target on this setup is approximately 33,000. As we shared earlier, this is arbitrary and we take into account current price action and also take into account the upcoming blockbuster IPO of OpenAI and Anthropic.
We derive these targets using standard deviation projection. It represents the area where significant buy-side liquidity accumulates from the previous highs — where the crowd who missed the rally will be chasing, and where late longs will eventually provide the exit for institutional players.
We had a move of approximately 8% ( 30600 to 28400). A 2 standard deviation move projection would be a 16% move off the lows.
The Invalidation: Respect the Lows
Every model needs a clear invalidation. This setup is invalidated if price trades below the current lows — approximately the 28,400–28,500 zone where we swept sell-side liquidity. There are no certainties in the market. If we manage risk appropriately then we get to eat.
If price revisits those lows, the Market Maker Model is telling us that the accumulation on the buy side has failed — and the distribution phase may be continuing lower toward a deeper liquidity pool.
There is no need to revisit this trade if that level breaks. Close the idea, wait for the next setup.
The Bigger Picture
The Market Maker Model is not a conspiracy theory. It is simply a framework for understanding how price moves to find the most liquidity.Markets are not fair. They are not designed for retail traders to win by simply buying breakouts and selling breakdowns.
They are designed to move price to wherever the maximum number of orders are sitting — and that means sweeping stop-losses before the real move begins.
Once you see this pattern, you cannot unsee it.
The Nasdaq chart above is a textbook example. The drop was deliberate. The accumulation boxes are forming. And the key level of 29,720 is the line in the sand.
Watch it closely.
Muffett Investments provides independent market commentary and analysis. This is not financial advice. All trading involves risk. Past performance is not indicative of future results.
For full stock analysis reports, proprietary scanners, and the Muffett Model Portfolio, visit muffettinvestments.com.