The more things change, the more they remain the same: Nasdaq weekend analysis
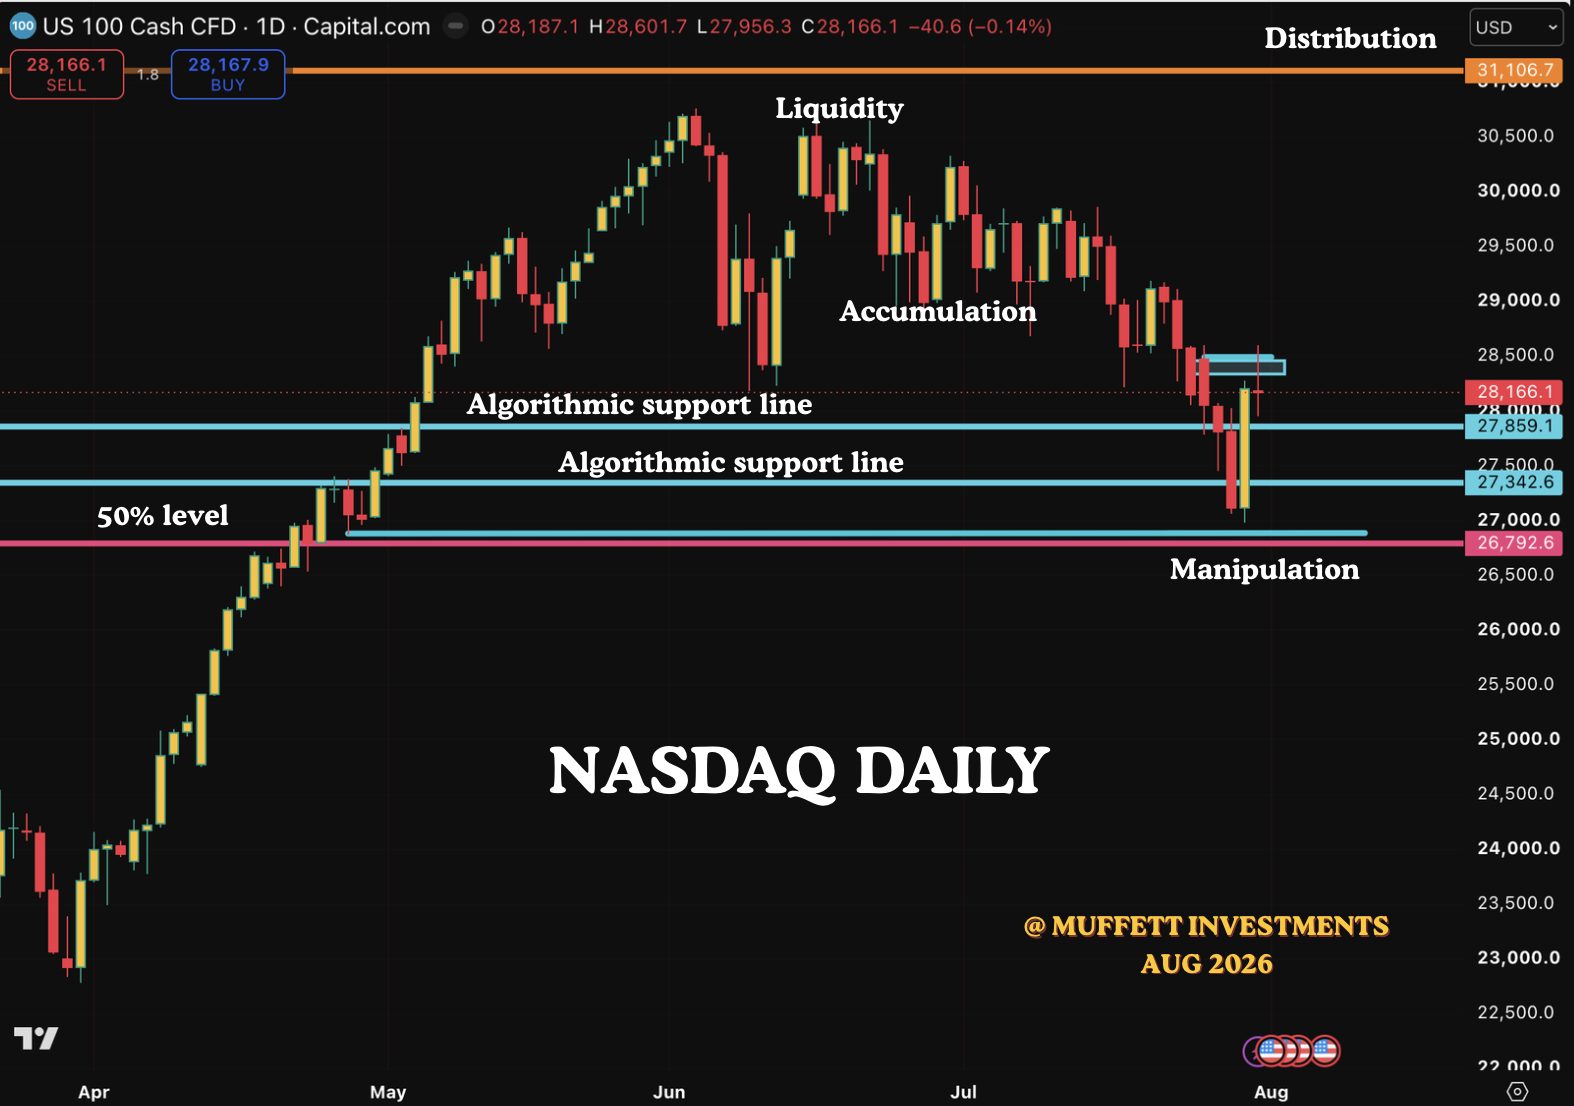
Since the dawn of humanity, we always have had bad actors. Every system that has been formed has been taken advantage of individuals in the know and they always try to manipulate the system to their advantage. That’s is the reason why all systems fail eventually. In the market, we have the market makers who provide liquidity. For them to be the opposite party of any trades( their obligation to provide liquidity) means they have to take risk and for this risk to be taken they need a reward and that is the reason why the price seeks liquidity to stop out traders, to create fear and induce people to short. The price is then manipulated in the opposite direction very quickly and stopping out the shorts and the longs. The market makers benefit from the move. The important thing to remember is that this happens in all time frames and it is a very simple scheme. Accumulation, Manipulation and Distribution. All you need to do is to spend some time on chart and see how this happens and what time it happens. Provided you have studied the charts enough, then in some ways the moves are predictable.
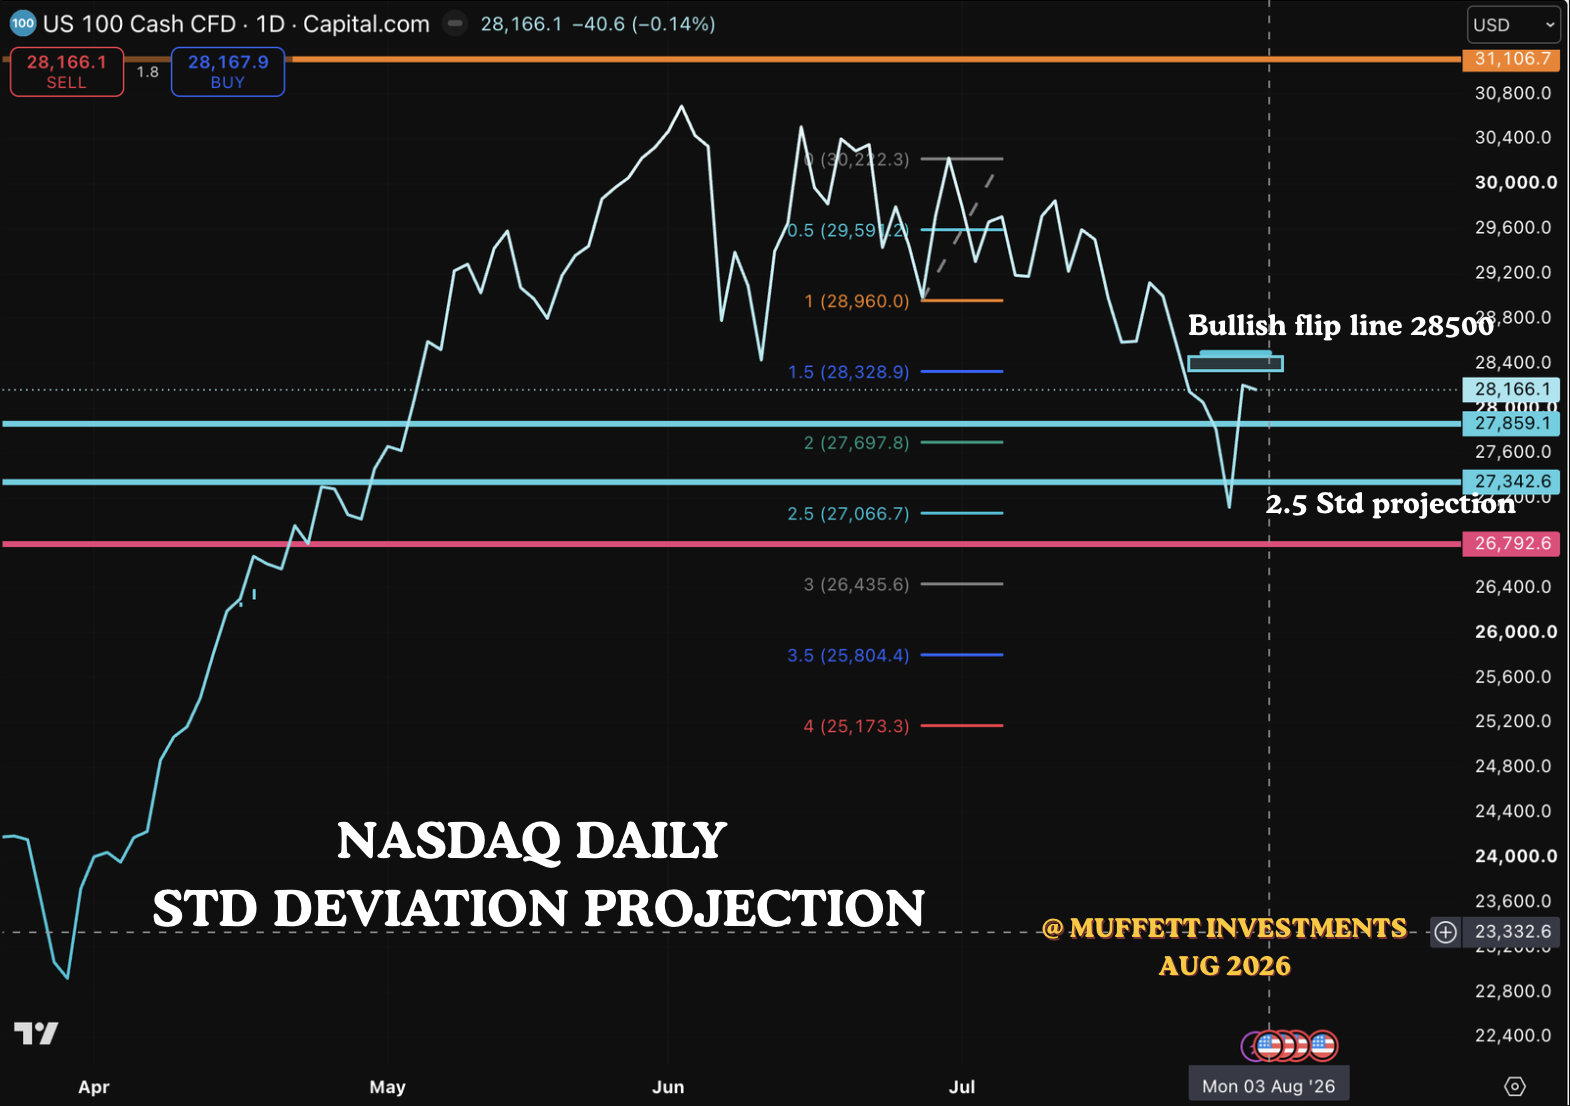
This is the same Nasdaq daily chart with standard deviation applied and we have a projection of 2.5 where price stops going lower and bounces. As we have explained in previous Nasdaq analysis we have not closed above the bullish line yet which is at 28500. As long as price is below that there is no confirmation of a reversal. But considering that we have had a divergence between Nasdaq and S&P 500 and the fact that heavy weights like Amazon, Microsoft and Alphabet have started moving higher, the chances of a move higher is much more than a continued move lower. This aligns with the incentives of the Trump administration. So our bias is bullish but we dont have confirmation yet and we have certain invalidation levels for the bullish thesis.
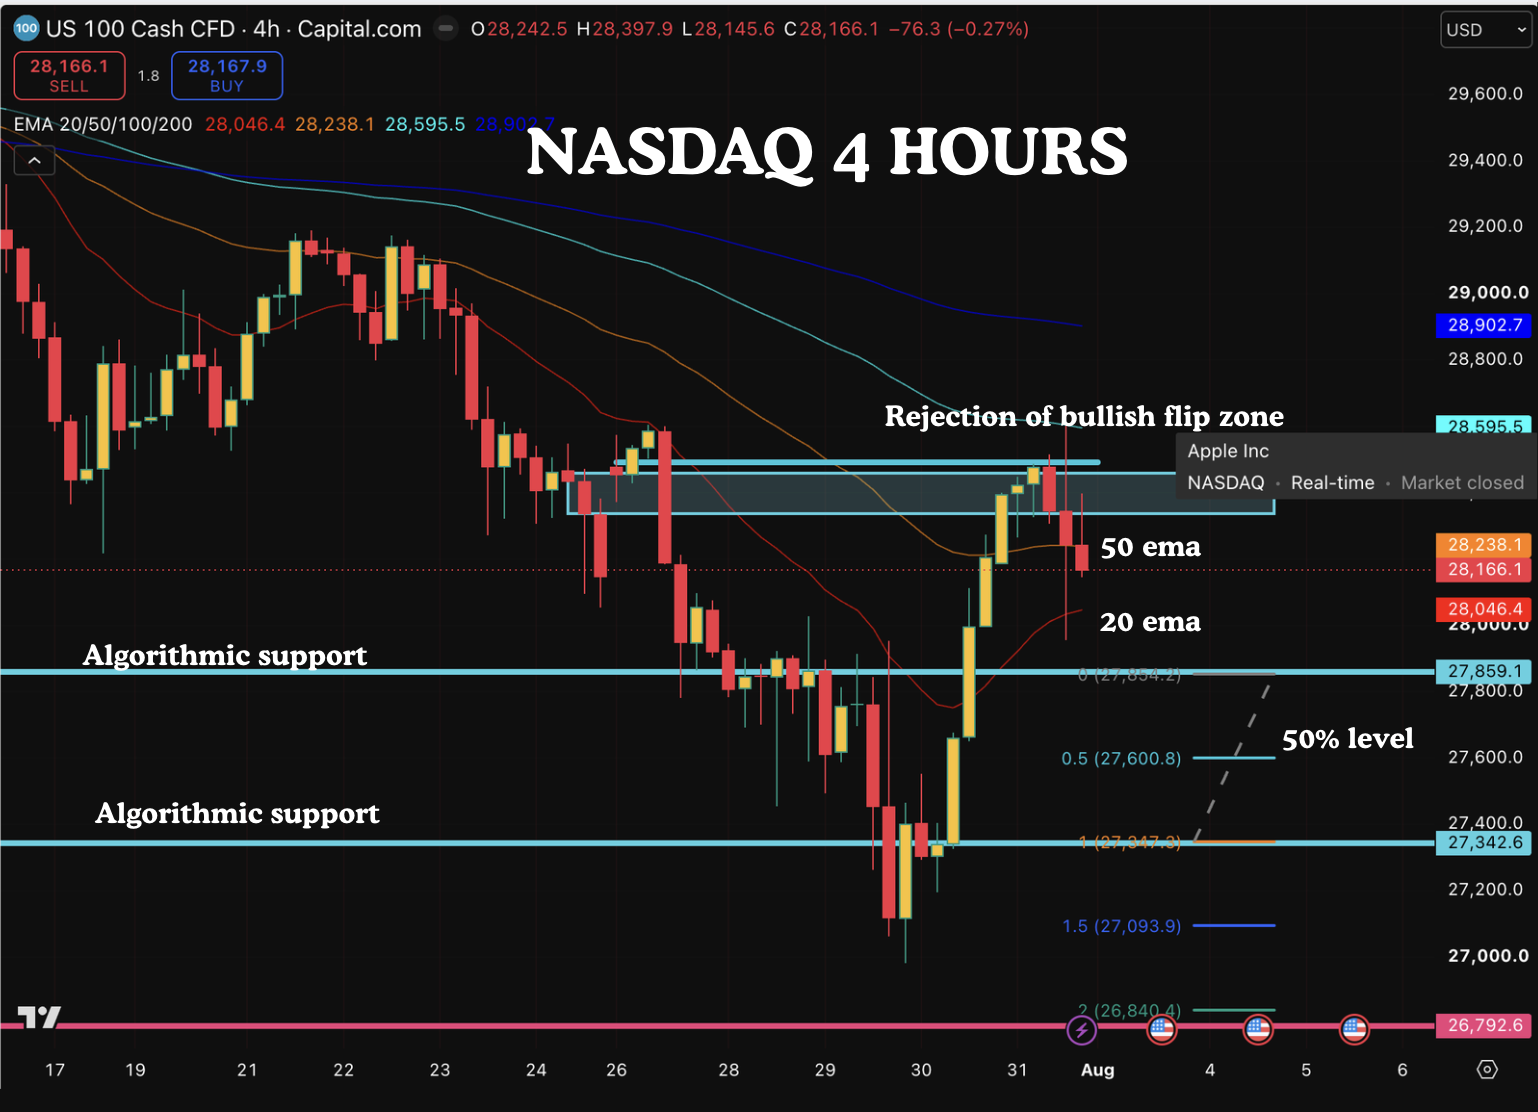
This is the 4 hour chart. of Nasdaq. The price is currently above 20 ema but below 50 ema. Our expectations for the coming week is a possible move between the 2 algorithmic support line - 27859 and 27342. The 50% of the range between the 2 lines is 27600. For a bullish bias, we should not have a daily close below the lines and we should not have a 4 hour close below the 50% line. If this were to happen, then our bullish bias is suspect and is likely to be invalidated. If on the other hand price tests the levels and rejects it, then it is bullish confirmation. Also there is a small chance that price may not reverse and continue higher. When the price closes above our bullish flip line of 28500, the 4 hour 20 ema would cross the 4 hour 50 ema. This is a trigger for algorithmic bots to take longs on the Nasdaq.
Muffett 1 hour time cycle indicator:
We are using this indicator in trading view and it is free. Muffett was able to use AI to code the indicator in pinescript. This is why we can be bullish on AI. Anyways, the idea here is 2 things
Sessional liqudiity raids
AMD patterns on lower time frame
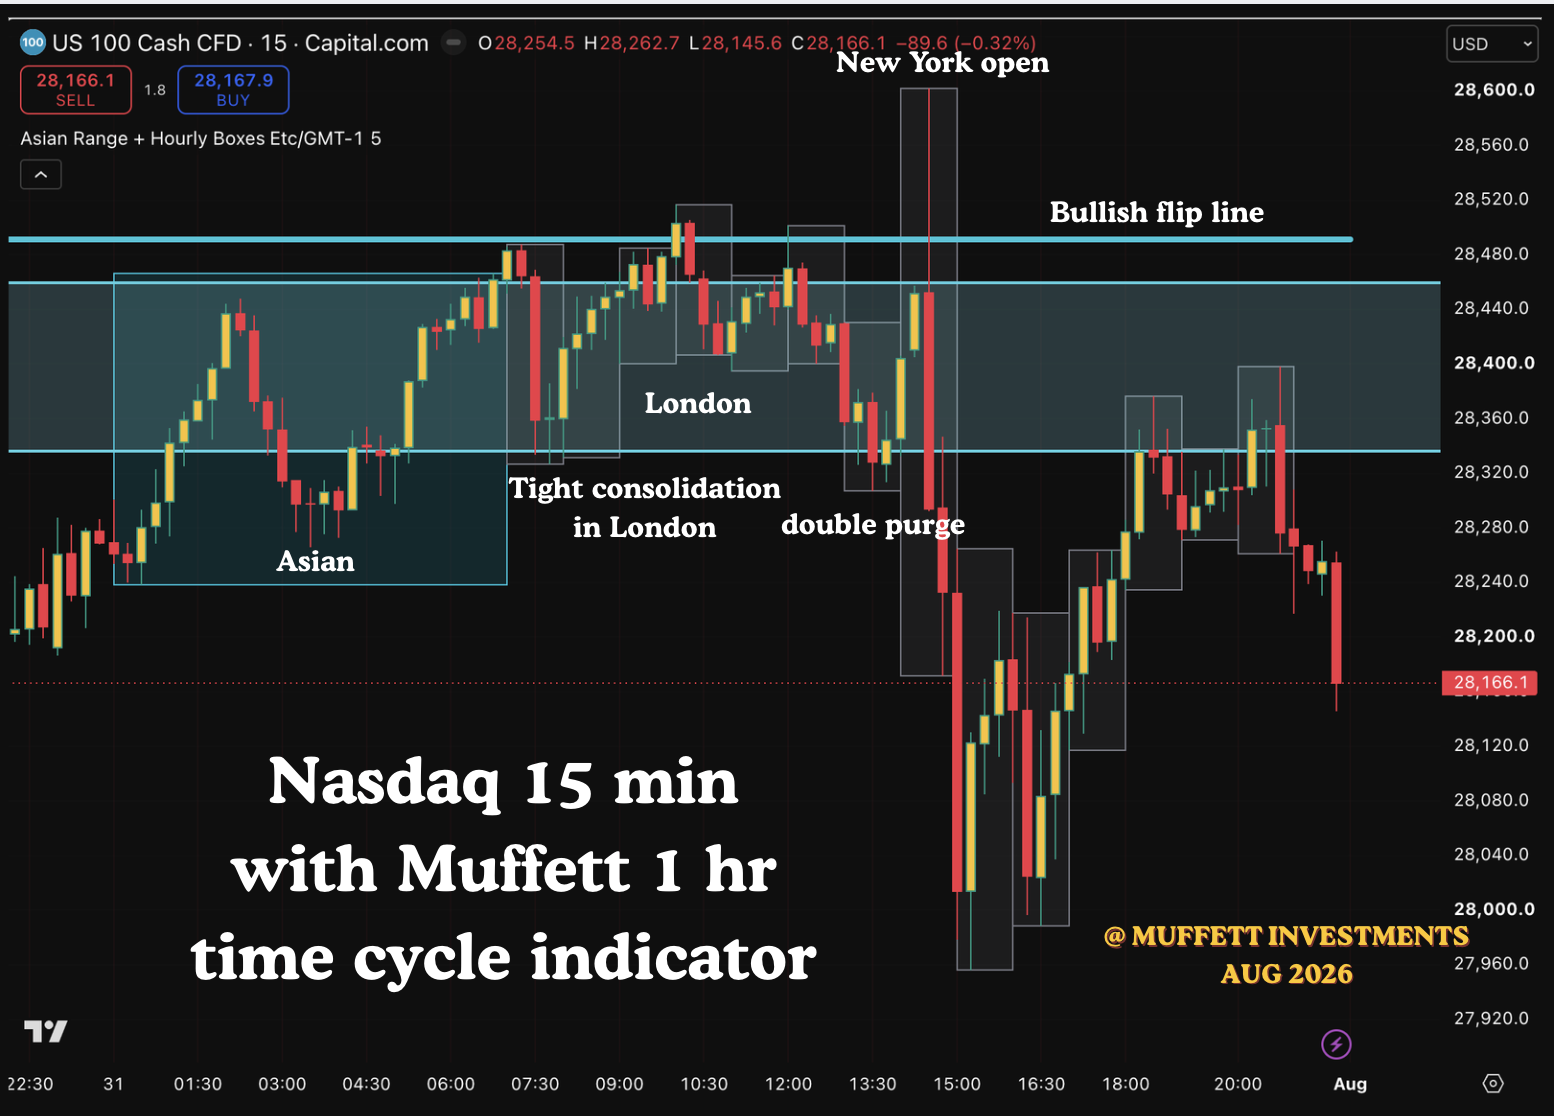
The above is an example. This is last Friday’s price action(31/7/26). The price had a big move up and then during the Asian trading, the price continued higher and was held by the blue shaded area which is the weekly opening gap. Then in London, the price was in a relatively tight consolidation. Then in the New York Premarket session, the price goes down and takes liquidity of London session lows. This induces shorts but at New York open price runs higher and stops out all the shorts and inducing longs before moving rapidly down to take the liquidity of the Asian session.
The Muffett 1 hour indicator boxes the Asian range and for each hour draws boxes. You can use any time frame below 1 hour for this. When you see tight consolidation, then you can expect the AMD happening in the lower time frame.
May the Lord God bless you and give you peace.
All analysis is done in good faith and is for educational purposes only.
