Nasdaq analysis 18th sep:
“Love the person, but give the person total freedom. If love is not giving you freedom then it is not love.”- osho
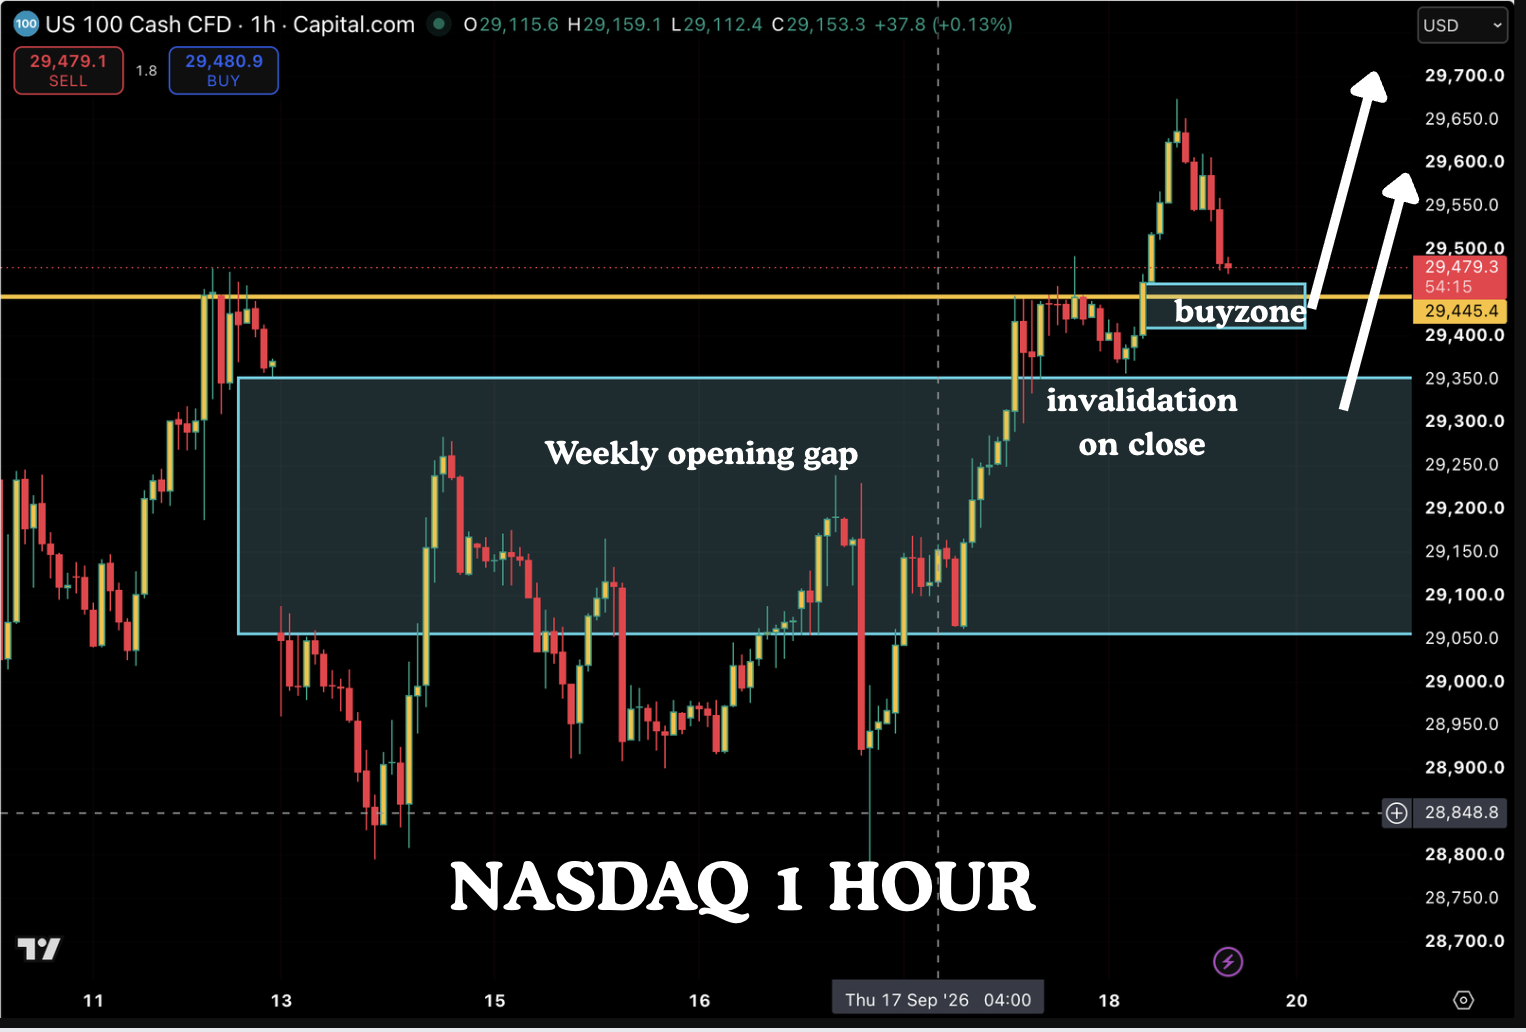
This is the 1 hour chart of Nasdaq. the blue shaded area is the weekly opening gap. The price has managed to close above the gap which is bullish. Although price had rallied hard during the London session, we are seeing significant pullbacks. But we are still bullish and we are maintaining longs until we have clear close on the 1 hour chart into the weekly gap area.
The price is currently near the buyzone and we have initiated longs here. We will have stocps below the last swing low.
Why are we so bullish you might ask? We say thatt it is because the sellside liquidity is taken and now it is more likely that buyside will be taken. we will illustrate this with the 4 hour chart.
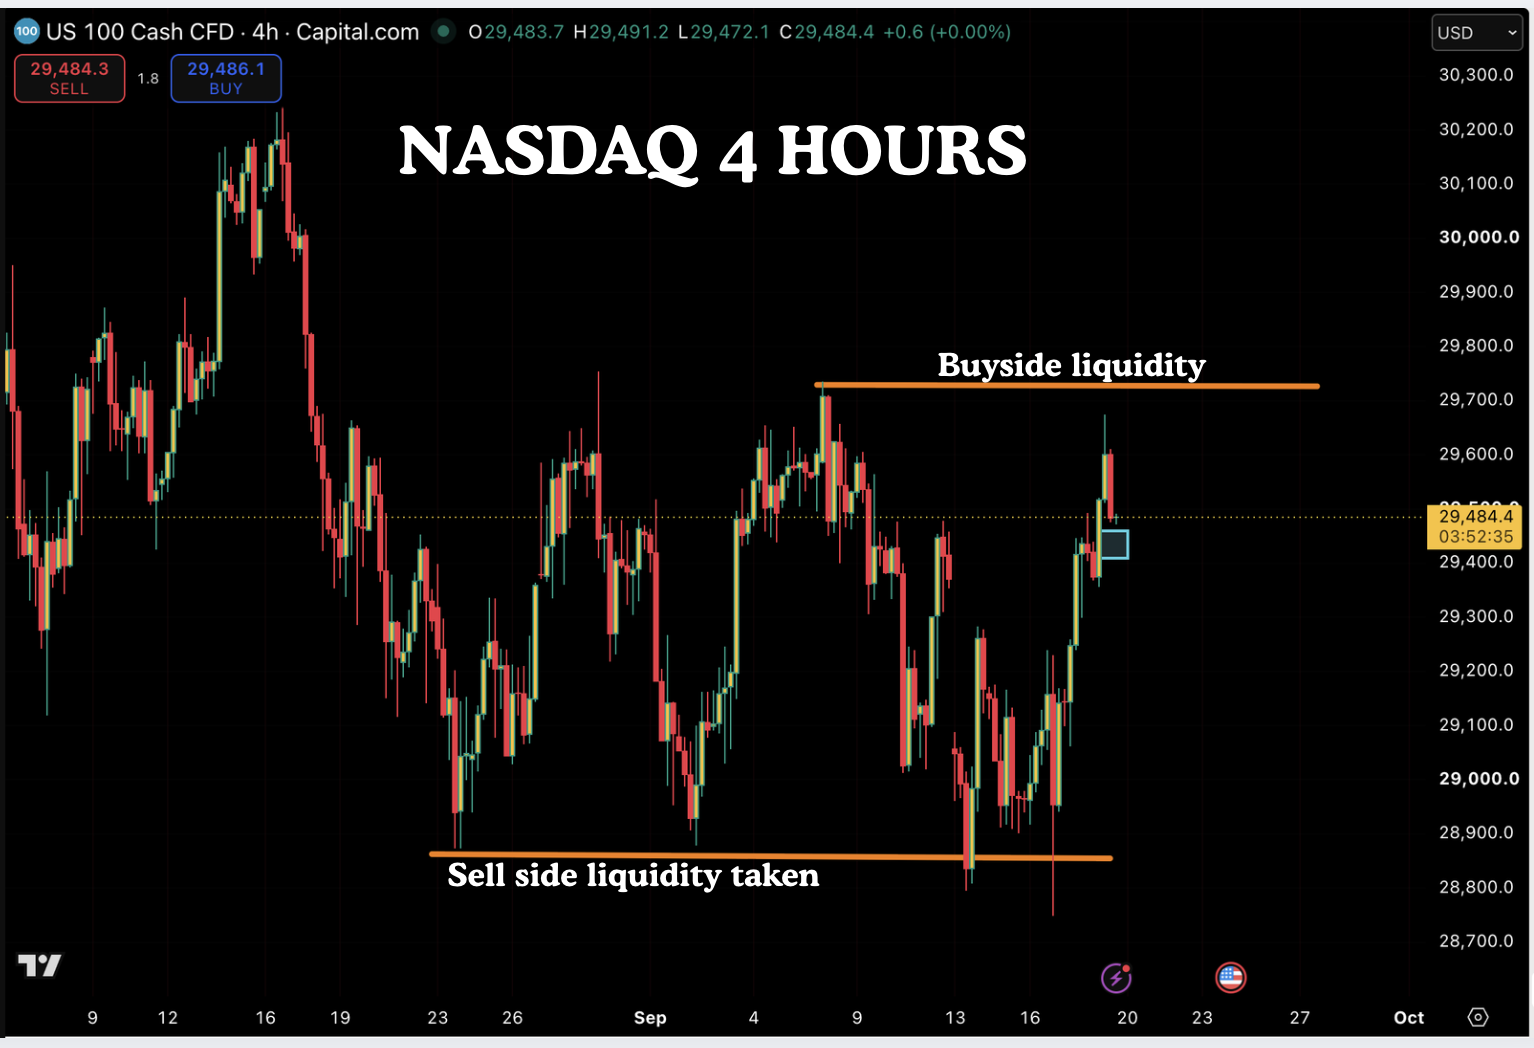
We are liquidity traders and so we are expecting price to take out the buyside liquidity. Whether we will take the buyside today or next week, only the market makers will know. But we suggest that we maintain a bullish bias particularly as we have seen divergence at the bottom.
All analysis done in good faith and not investment advice.
