Looking at the crystal ball: Nasdaq levels to watch for
The headline suggests that Muffett is able to predict correctly the price action of Nasdaq. But what we do is a follow a framework which will offer a strategic edge compared to other forms of technical analysis. Again we are not saying that this is the best but we are convinced of its edge. Now let’s look at the crystal ball.
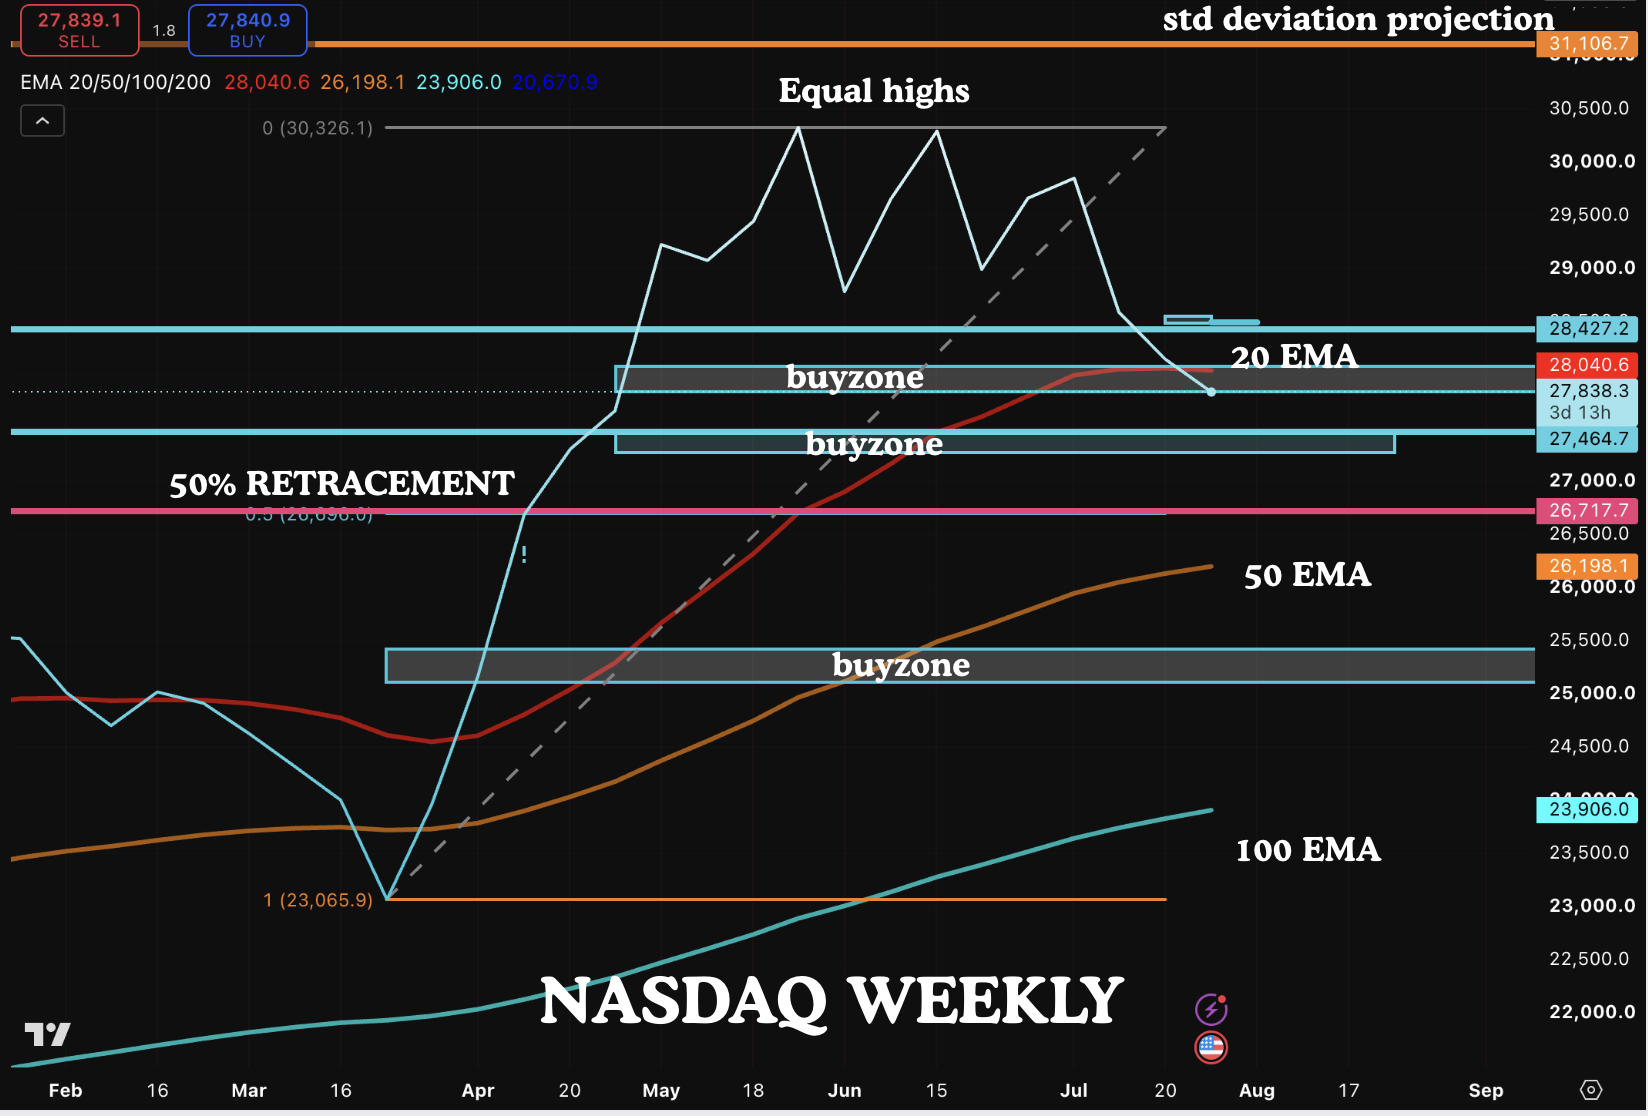
This is the Nasdaq weekly chart. We have applied the EMA’s and the Fibonacci retracements. 50% retracement is 26700. The price is currently just below the 20 week EMA. We have been of the view that the 20 week EMA should support prices. Currently this is not the case. But it is often the case that price goes below the EMA and then bounce back. So we are watching if the price can bounce back quickly. Importantly, the price is below the buyzone. The buyzone is a support zone and when the support zone gives way, it becomes resistance. So we have resistance just above us now.
If the price cannot recover the buyzone this week, then the price can test the lower buyzone which we have marked. Anything is possible so we have to adjust ourselves depending on price action.
Our current expectations of a bounce from the buyzone has been invalidated. But all hope is not lost yet.
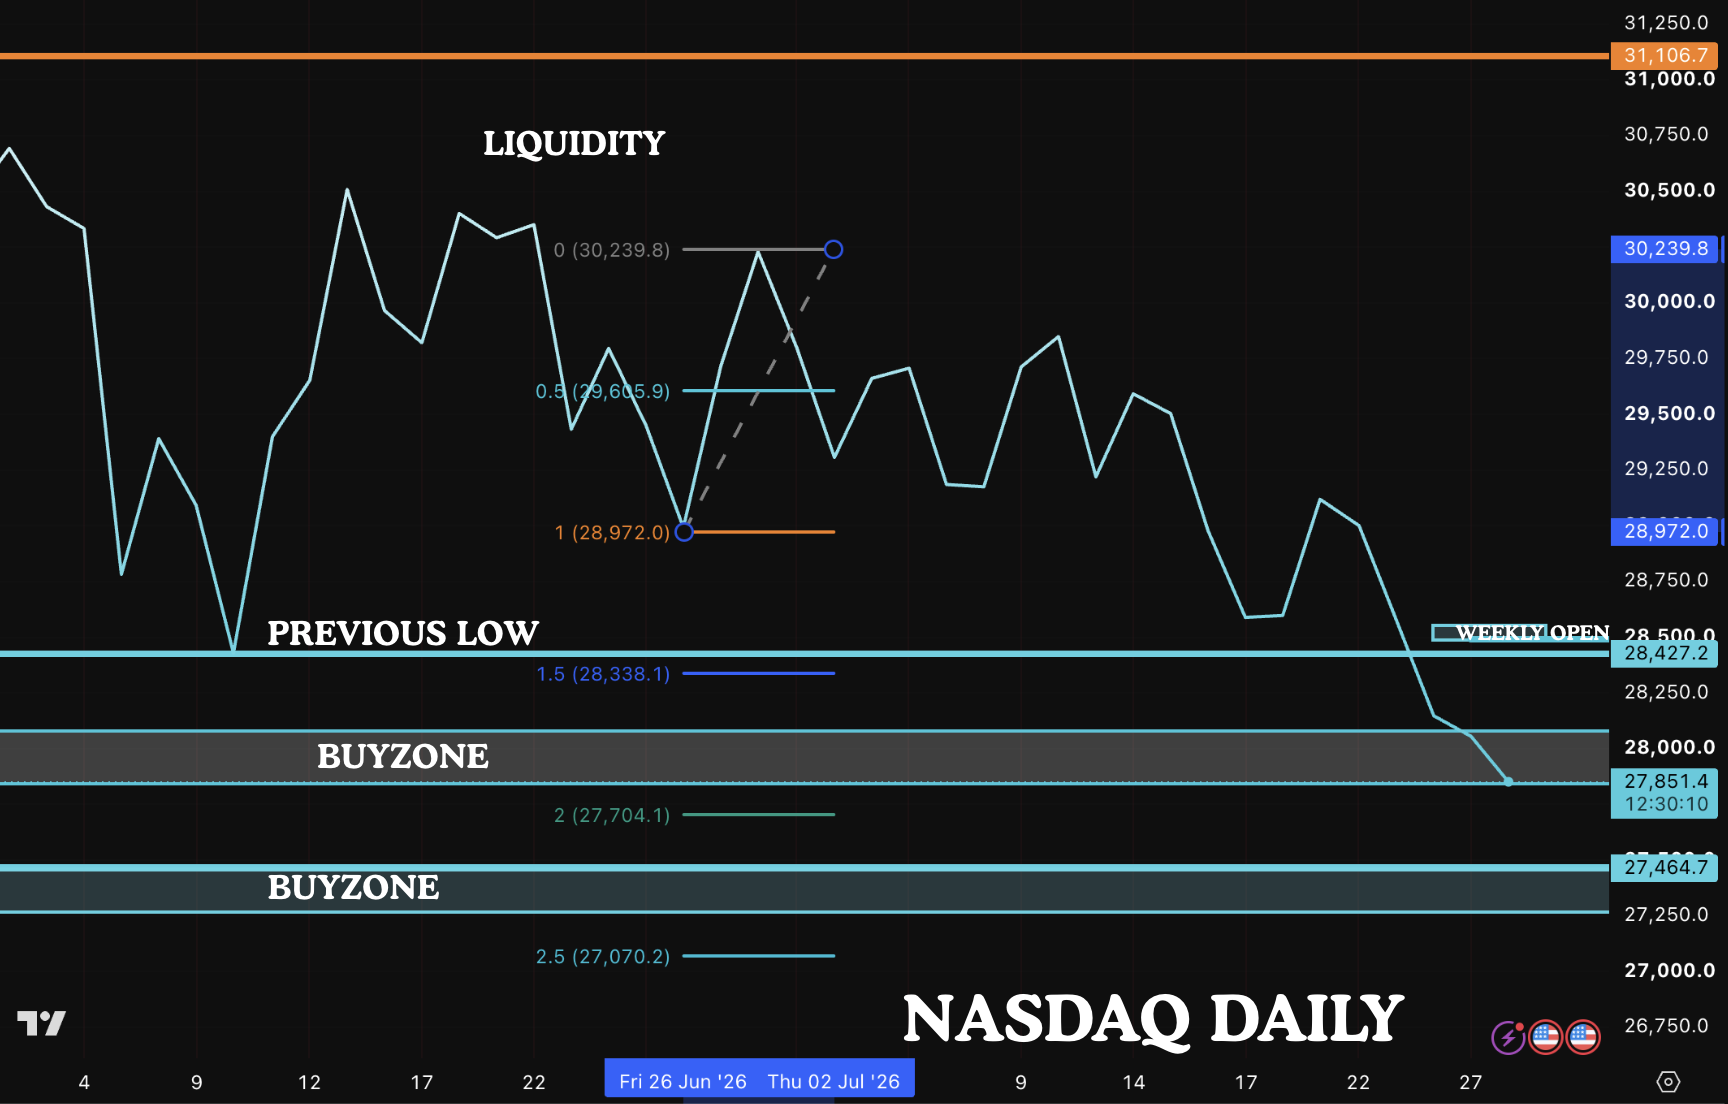
Here is the daily chart. We have drawn the weekly open which is at 28450. This level is very important. This level in algorithmic terms will flip the market bullish. From a market maker view point, the price was gapped up from a buyzone inducing buyers to buy and the price was quickly moved down stopping out most buyers. Price has also been aggressively moved below the 20 week EMA and stopping our algorithmic bot stops. The price is now bouncing but we need close above 28450 for the bullish bias. We need to observe closely the price action in the next 2 days. If the bullish view is clearly invalidated, then we may have to close some positions strategically to enter at lower levels.
The standard deviation projection showed a 2 standard deviation projection at 27704 which is where the low has been put in this morning. The 2.5 standard deviation is 27070.
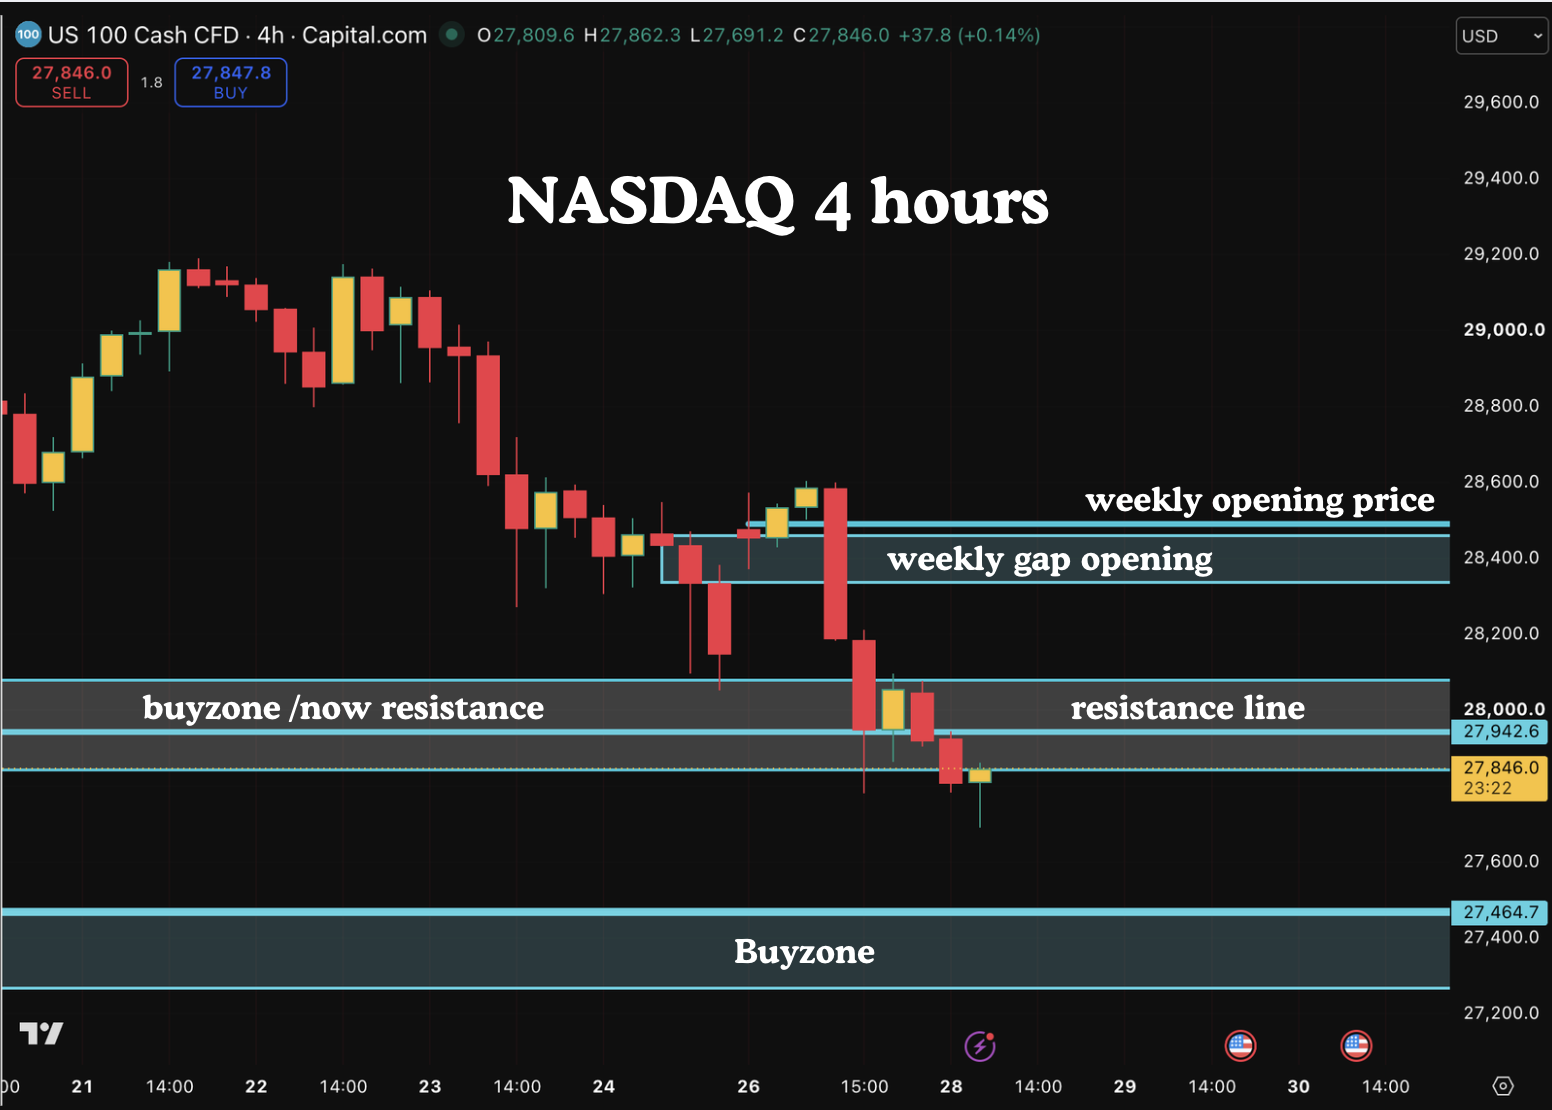
Finally the 4 hour chart. This is the current price when we started doing this analysis. We ahve resistance at 27942. and Ideally we need a close above the buyzone which is not resistance. This might need earnings from tomorrow to do this. But we are watching this zone closely. Ideally if we can close today above the buyzone, we can still be bullish. If we have a clear close below the buyzone today, then 27464 buyzone will be in play
All analysis done in good faith and not investment advice
May the Peace of the Lord be with you always.
