Is the Nasdaq correction over?Nasdaq analysis- 07/02/26
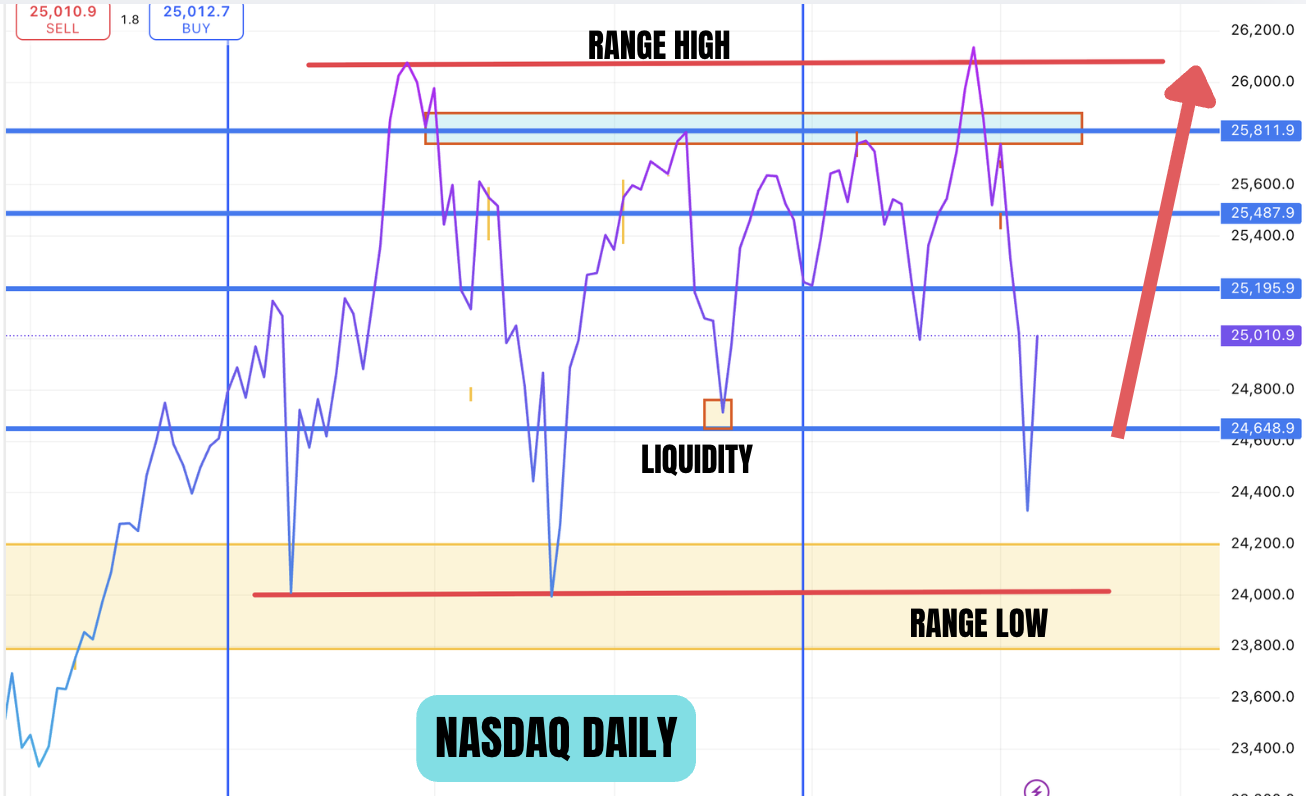
This is the Nasdaq daily chart. As we have pointed out earlier, the price has been in a range since October 2025. The price went to the top of the range and took the liquidity out and then the price was moved down to the bottom of the range to take liquidity. This is typical of price action in consolidation.
In Algorithmic trading, consolidations are followed by expansions. If you have been following us, we have maintained our premise that Trump would want the markets higher going into the midterm elections and that there wont be a big correction in the market. There are algorithmic signatures which suggest that the market might indeed have made the lows for the first half of the year. You have to remember that there are no certainties in the market and the above statement holds true only if certain conditions are met.
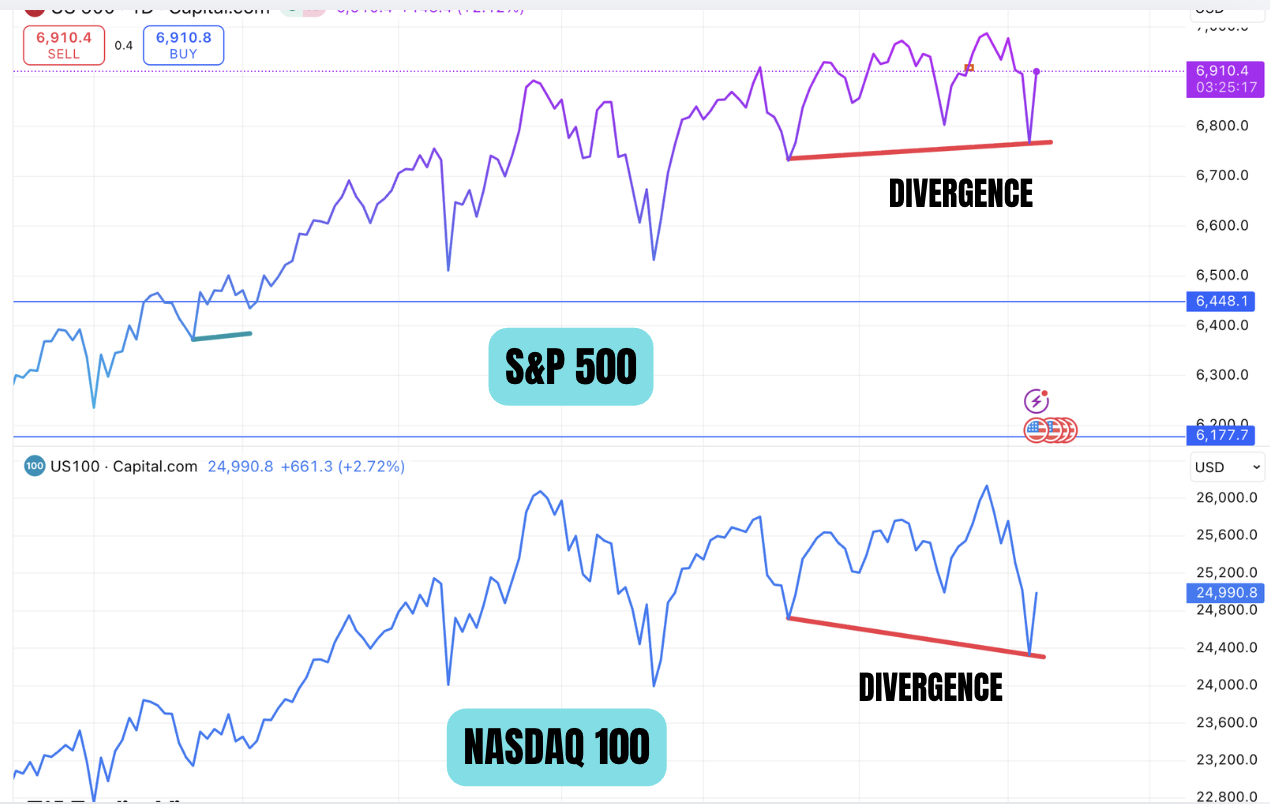
What is making us to believe the lows have formed? The above chart compares the daily price chart of Nasdaq and S&P 500. As shown the nasdaq made a lower low while the S&P 500 made a higher low. This indicates that S&P 500 is showing relative strength and going forward, we can expect stronger moves in S&P 500.
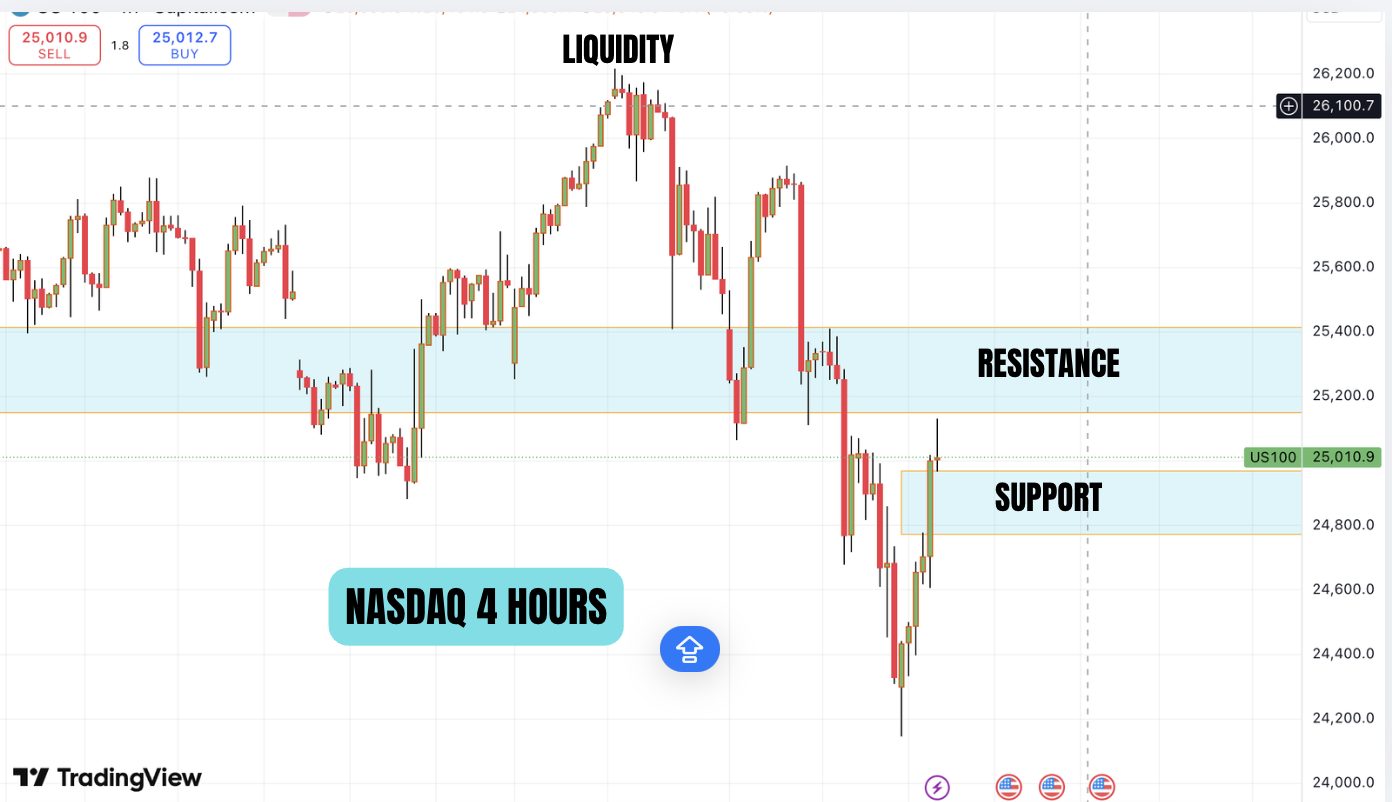
This is the 4 hour chart. we have drawn support and resistance for Nasdaq. Price should break resistance with speed and magnitude for confirmation of uptrend. Ideally price should not go below the support but we will maintain a bullish bias as long as price does not close below 24,400.
How far can we Nasdaq go during the first half of 2026?
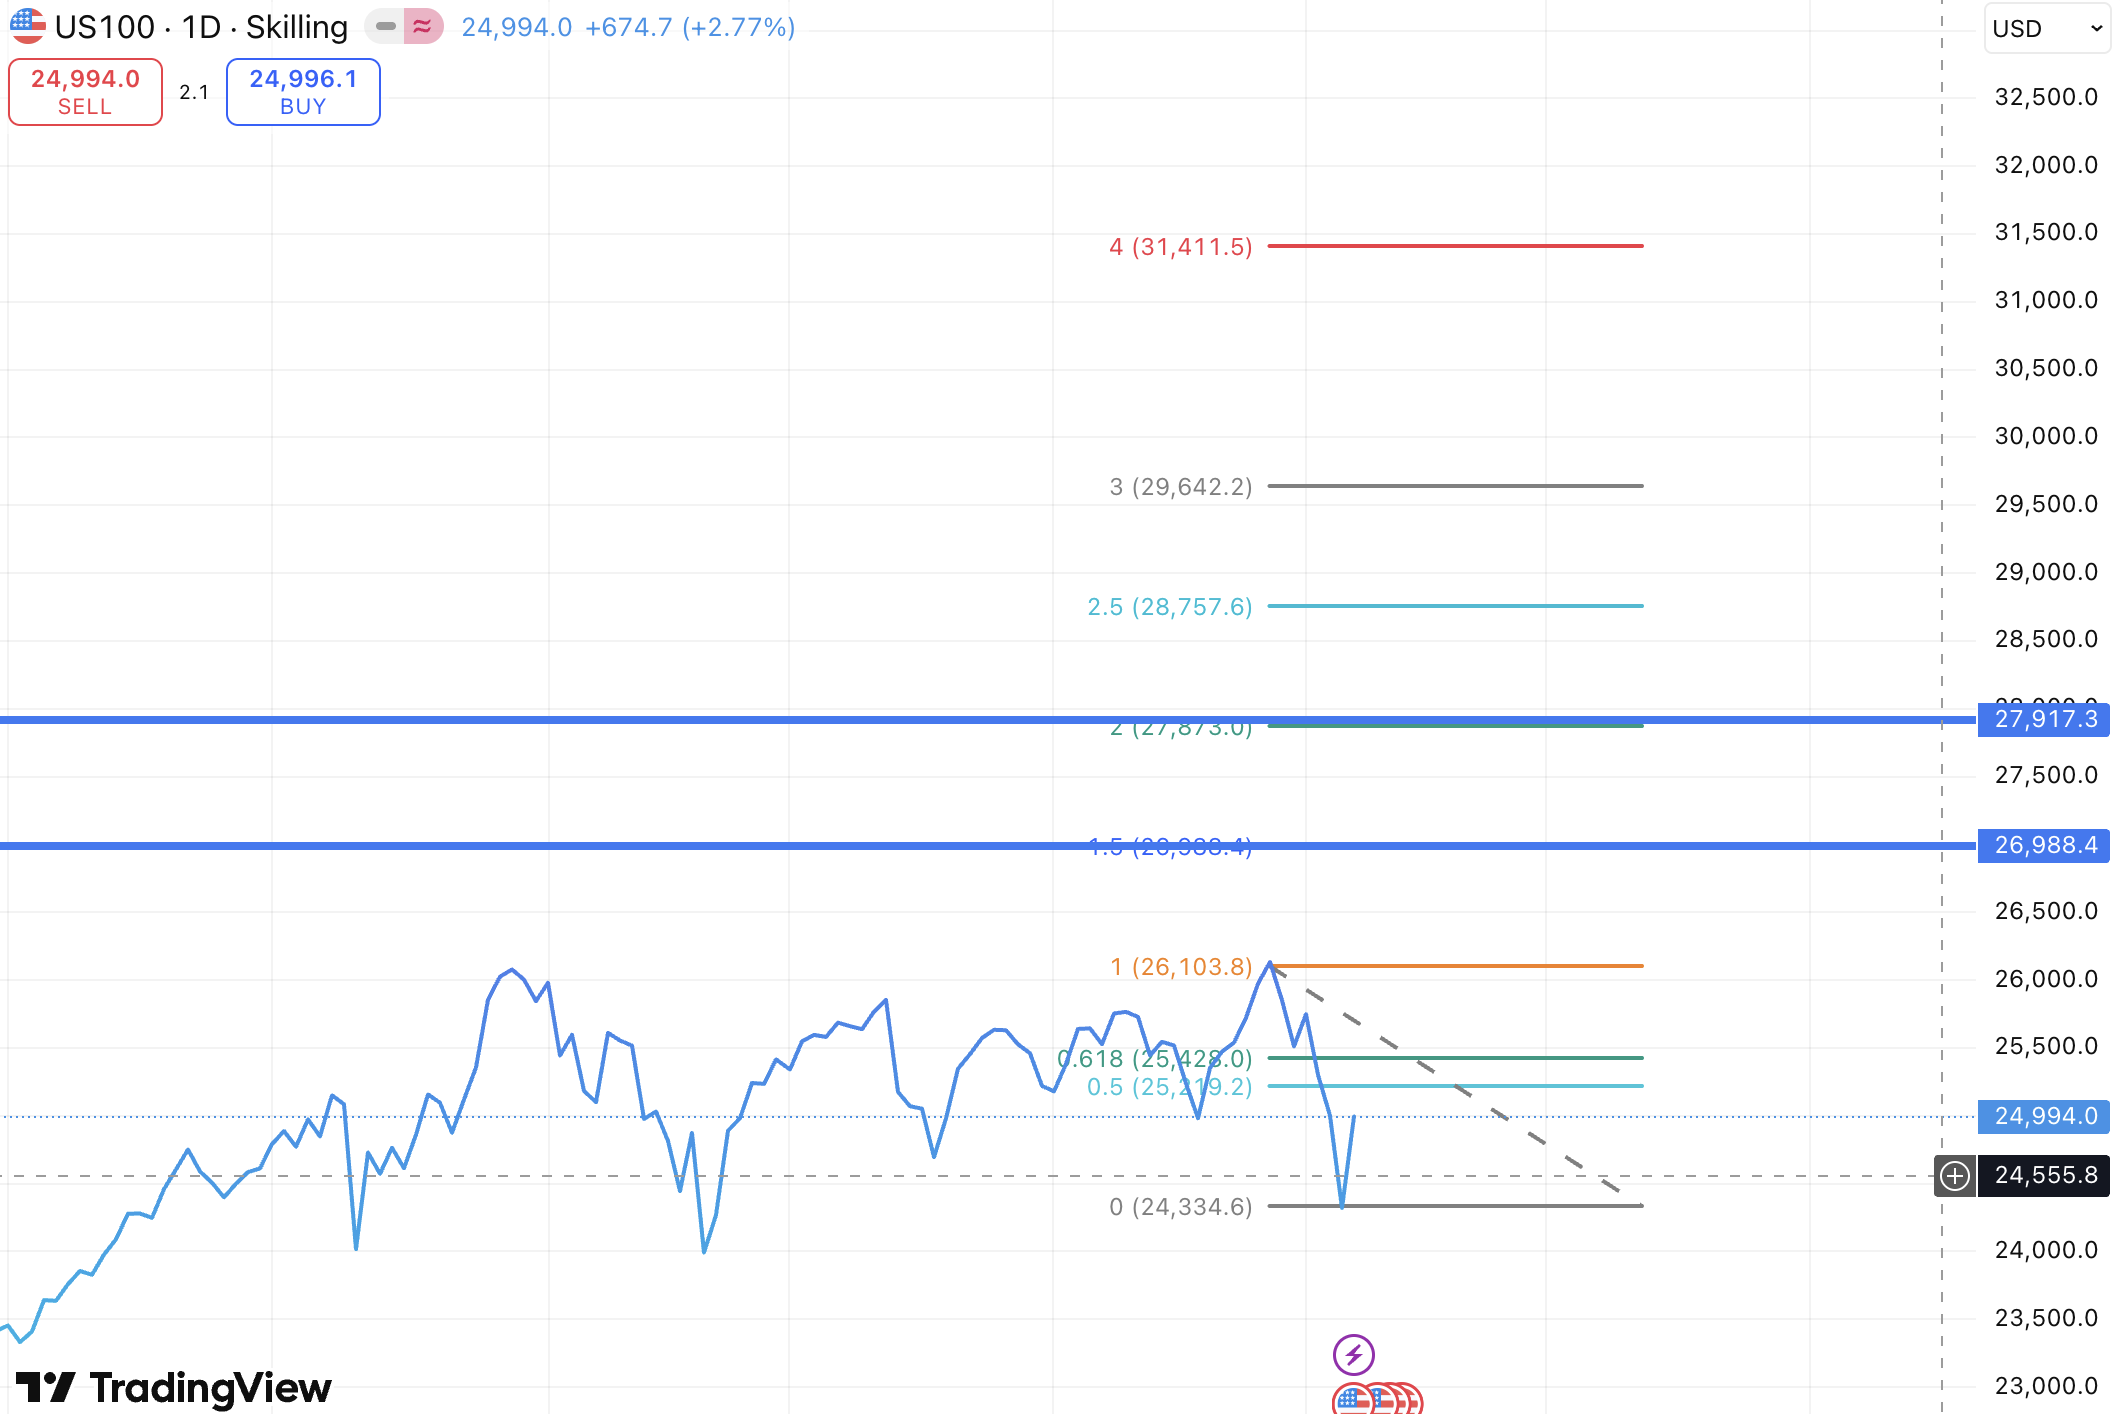
Here we have drawn standard deviation projection and we are looking at a move towards 27,000 to 28000. This would be a 2000 to 3000 point move and once the resistance is broken we should be fully invested to participate in the trend.
But it is also important to remember that there are no certainties and only probabilities in investing.
May the peace of the Lord be with you all.
Disclaimer: Analysis done in good faith and not investment advice.