USDJPY 4 HOUR ANALYSIS:

Here we present the 4 hour chart of the USDJPY. You can see that the price was in a consolidation for a long period. We have marked the range highs and lows. The reason for the consolidation is to accumulate positions and also there were no big drivers of the currency pair during that period of time. The price was kept in consolidation until a news driver caused price to go out of the consolidation. First, as is usually standard for any consolidation, there is a price run to induce market participants in the wrong direction. Then the price is suddenly moved to the opposite side of the consolidation. The price has now left the consolidation but has yet to take out liquidity. We think that it is very likely that the liquidity will be taken out. On this basis, we have our buy zone market. we have taken long positions in USDJPY on top of the ones that we already hold. This position will give a nice 1:4 risk reward trade. The target is shown in the chart.
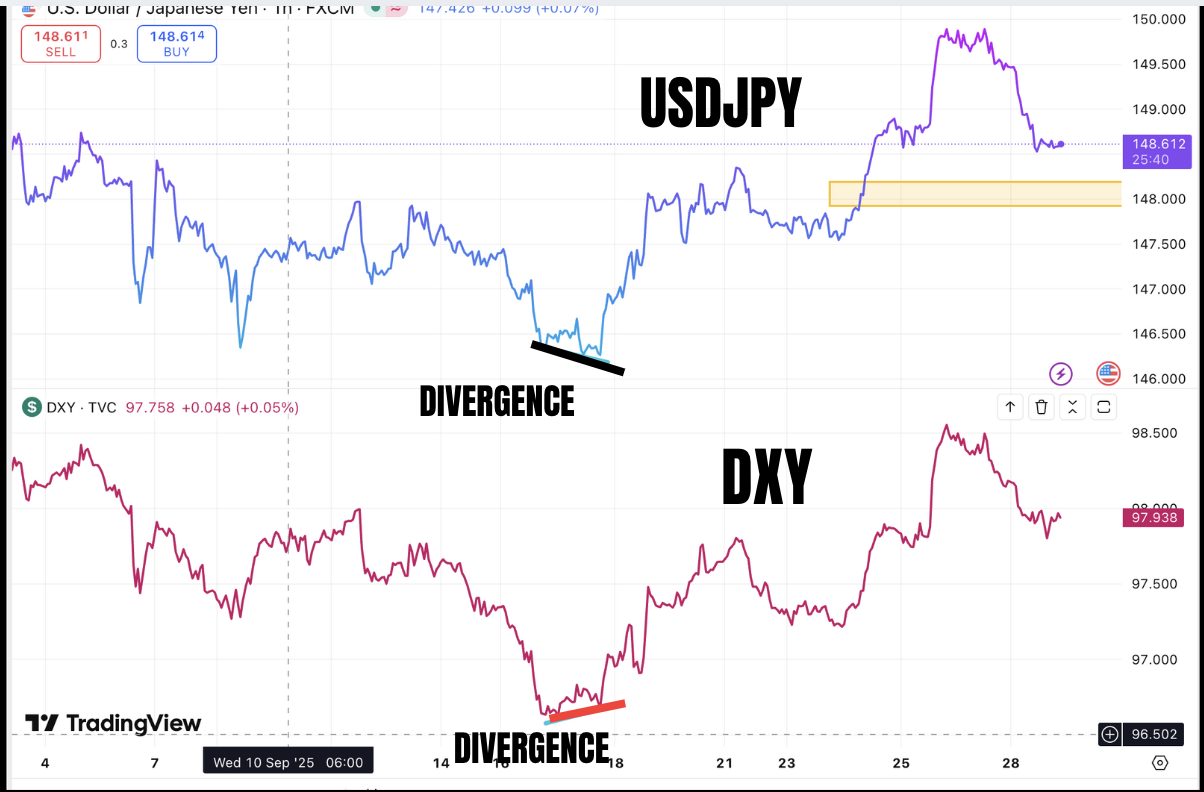
This chart was made on the 29th september 2025. Obviously the price has moved lower from yesterday. But this chart was made to show the divergence between DXY and USDJPY. at the bottom of the price move. The USDJPY made a lower low while DXY made higher low. This is divergence and if there is divergence present then it is more likely that the liquidity will be taken above.
However as in all financial market trading we need to have stops as we are not always right. So if price closes below our buy zone on a 4 hoursly basis, then we are wrong and we will be stopped out of all positions in USDJPy.
This analysis was done by Muffett investments in good faith and not investment advice.