Gold analysis 21/9/2026
‘“To be creative means to be in love with life. You can be creative only if you love life enough that you want to enhance its beauty, you want to bring a little more music to it, a little more poetry to it, a little more dance to it.”- Osho
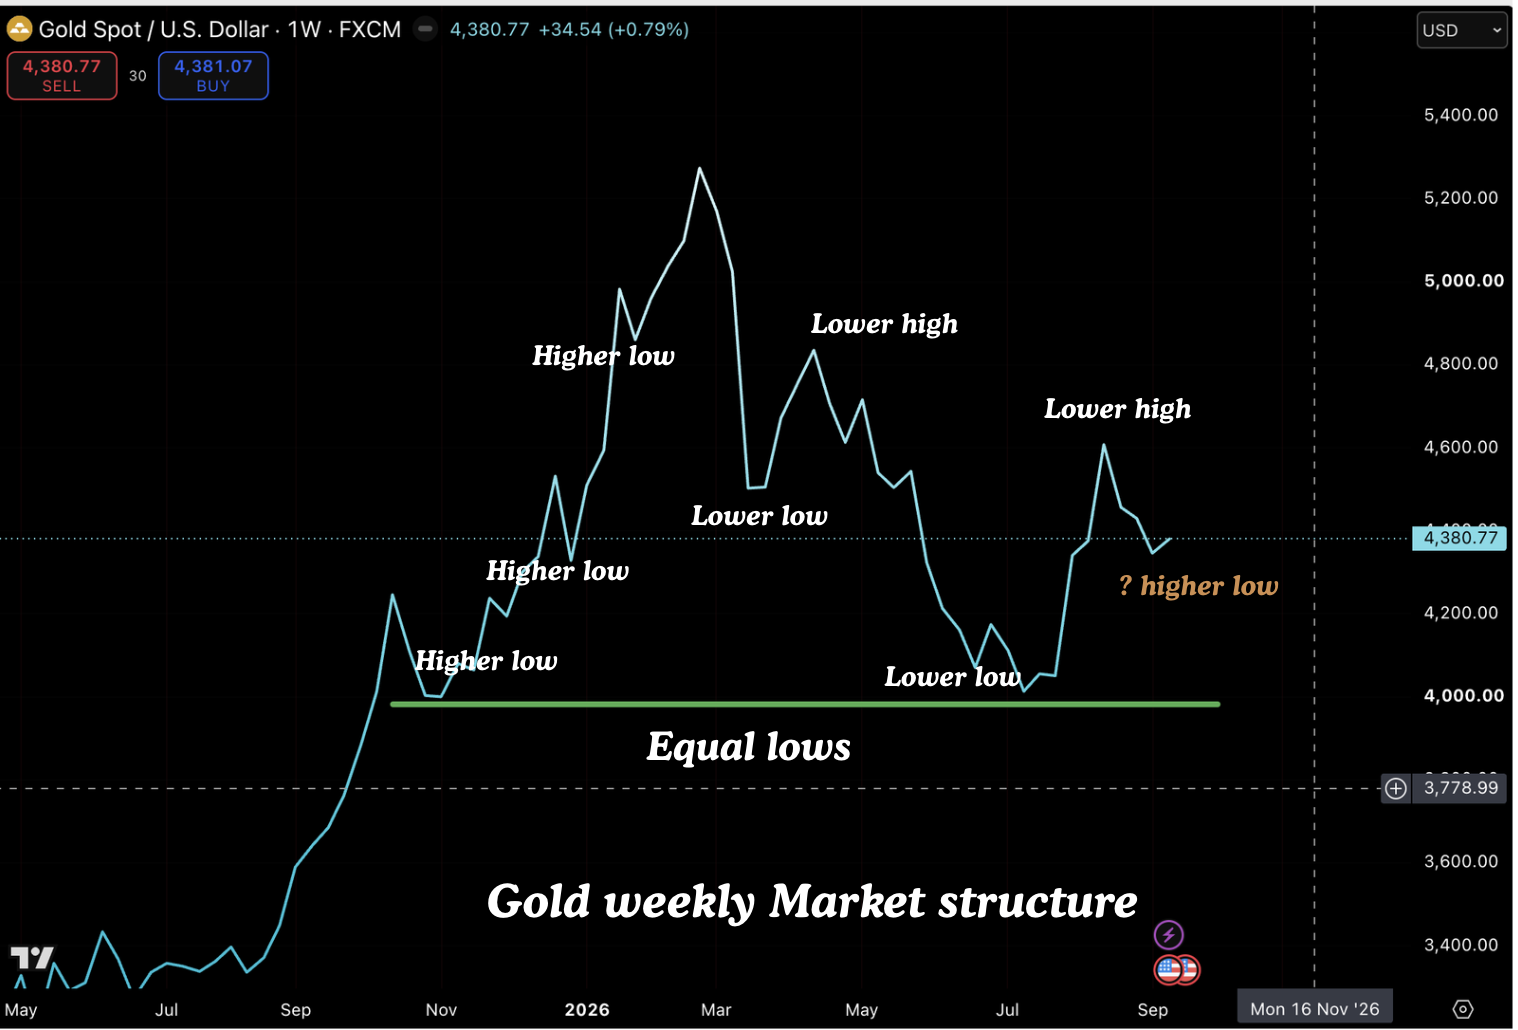
This is the weekly chart of gold. If we look at the weekly chart, currently the market is in downtrend although the market structure at the present says that we should be on the sidelines. However our fundamental bullish bias keeps us looking for opportunities to go long. So currently we are looking for confirmation of the uptrend. That would mean a weekly close above $4610. If this happens, then the stage would be set for a move to $4850 and then $5000.
But if price breaks below $4300, then there is potentiaal for a move below $4300. So we have to wait for the market to give a clear confirmation signal. we will buy aggressively if price goes below $3900. So in our view a move below $3900 presents an asymmetric bet on money supply growth for which gold is proxy of.
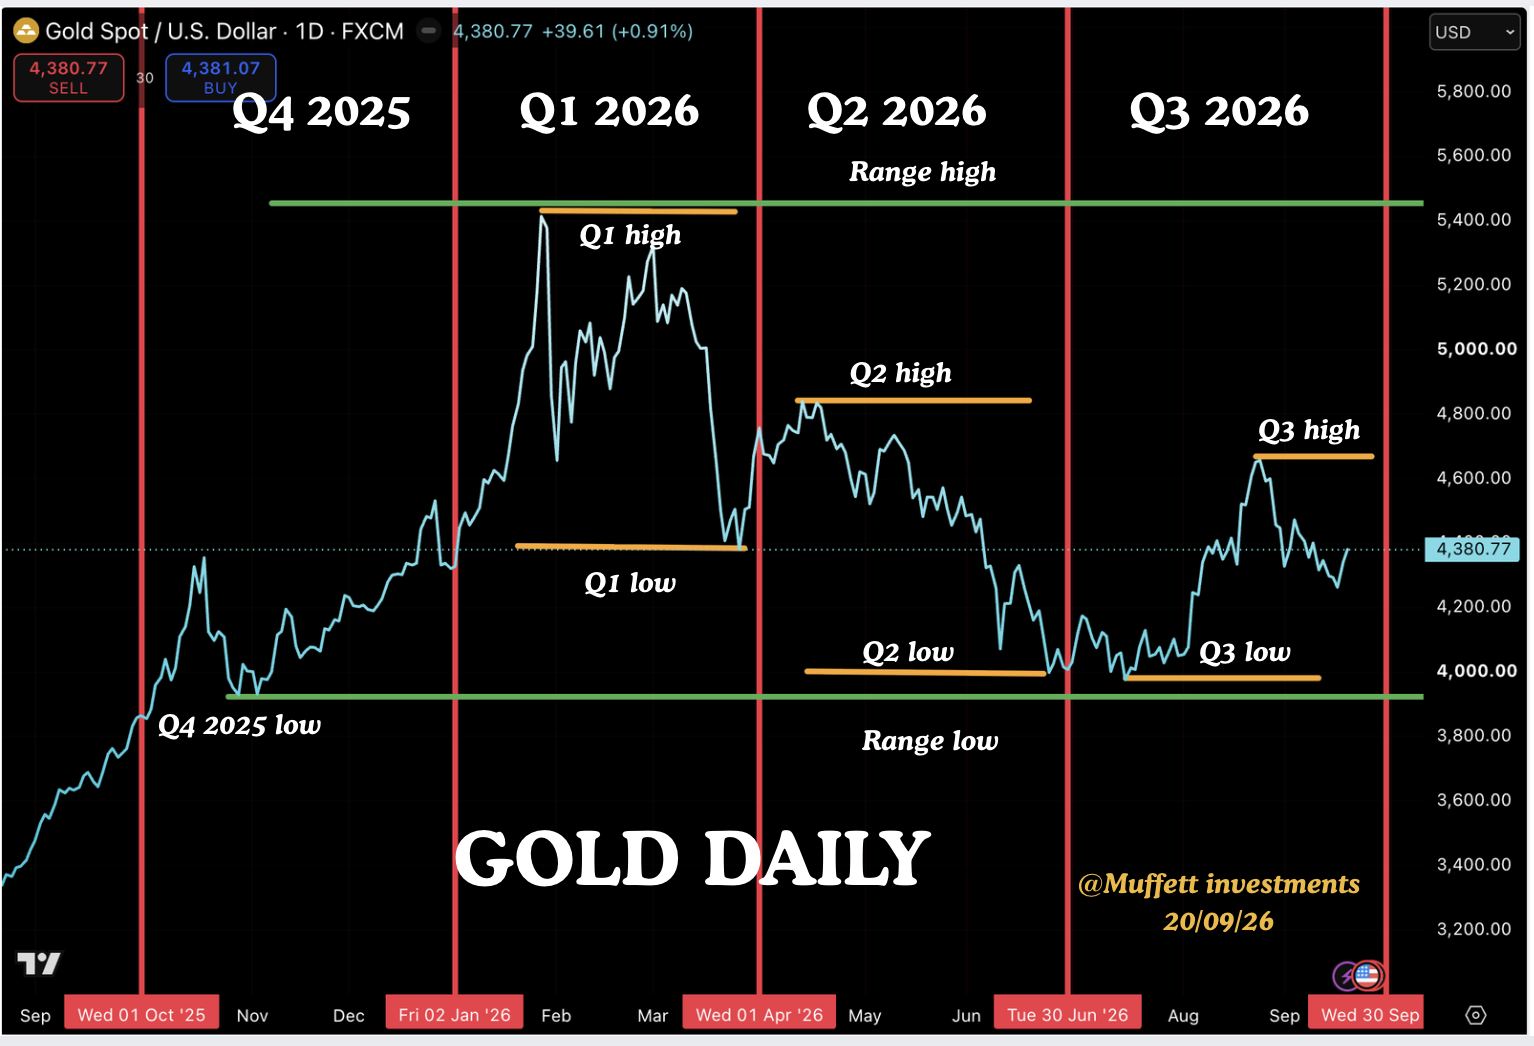
`the above is the daily chart of gold. we have divided the chart into quarters and here we are looking at algorithmic theory which says that when one side liquidity gets taken then there is a good chance that price will take opposite side liquidity. The idea of separating the chart into quarters is to identify quarterly liquidity pools.
we ahve marked the highs and lows of the quarter. The green line represent the q4 2025 low which we thought would be purged but this didnt happen. this has made equal lows and we know that the equal lows can always be targetted. this is a common market maker trick. They create false bottoms and move price higher to lure longs before moving the price aggressively down stopping out the longs. so at Muffettinvestments we are entertaining the possibility of price going below $3900 but we are currently long on gold miners in our portfolio. we will increase the position size on move above $4600 and reduce positions on a close below $4300.
If you look closely however, the price in Q3 goes below the Q2 low and takes out sellside liquidity. The price then comes beck into the range of Q2 high and Q2 low. In algorithmic terms, we have had a purge of Q2 low. So per the algorithmic concept of liquidity, we can expect a measure of buyside liquidity to be taken. In this case, the buyside liquidity is at $4850 which is the reason for our call for a move to this level in previous posts.
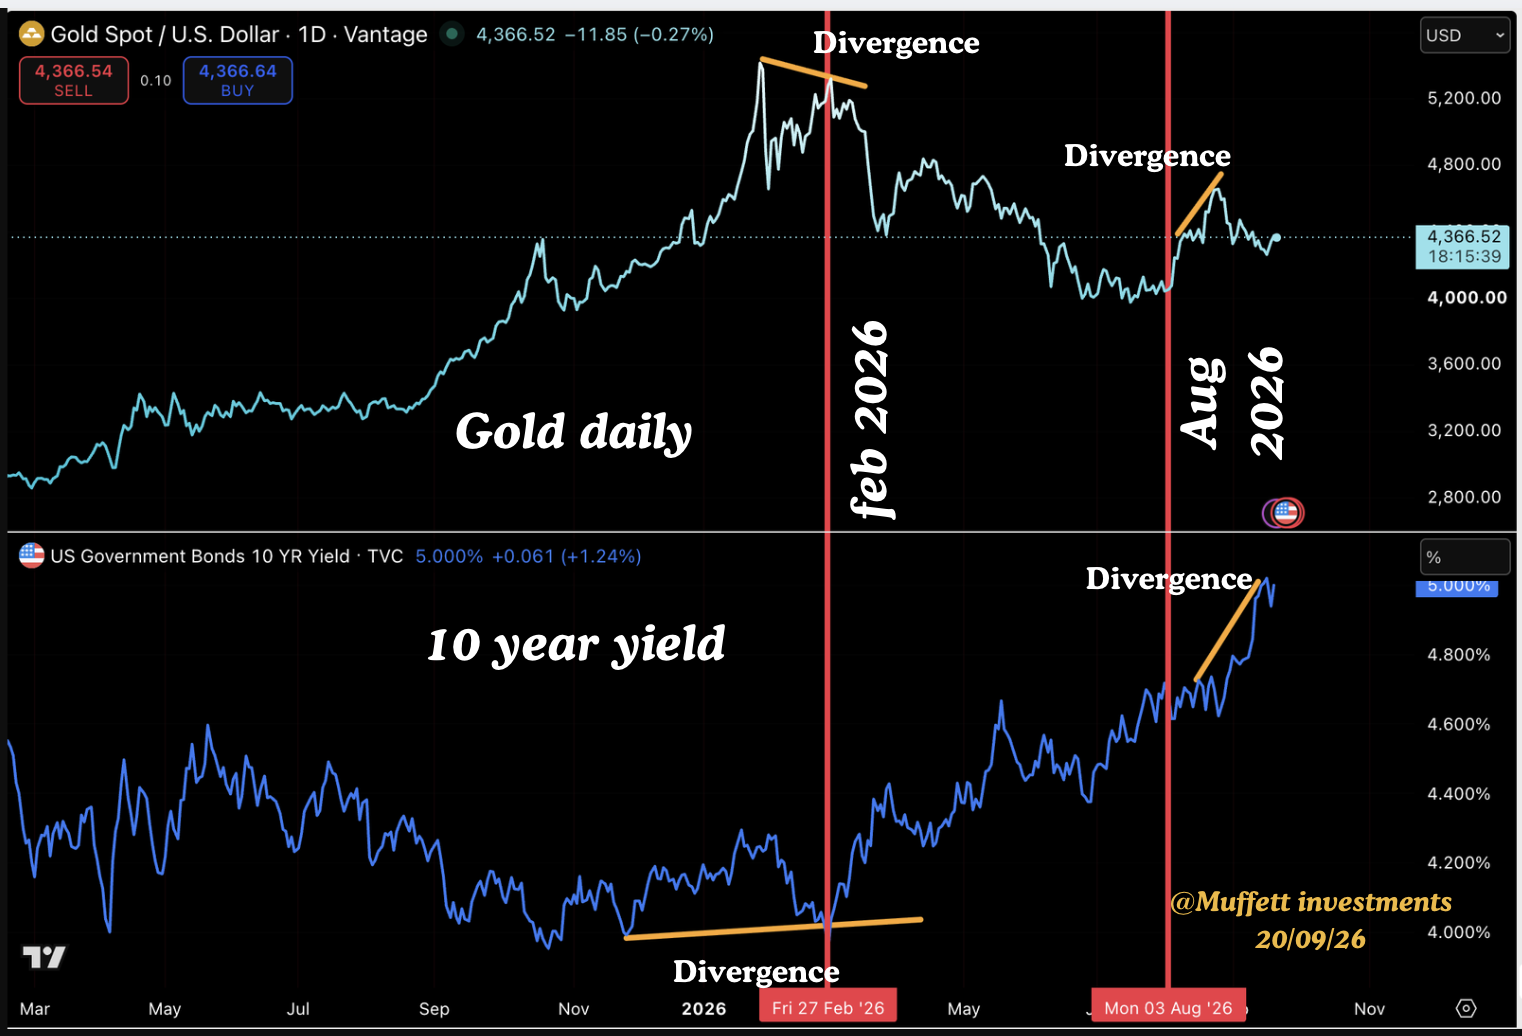
`this chart compares the 10 year yields with gold. Both have an inverse relationship generally. so if the yield goes up then gold falls and if the yields fall then gold rises. In Feb 2026 when gold was topping, we had the 10 year yields making a higher low. this is a correlated move and that is what we expect between gold and the 10 year yield.
A divergence has now developed between gold and the 10 year yidls. Normally with the rising 10 year yields, the gold should fall. So one of these moves is a false move. And if you believe that the market can be manipulated and then we can say that the move in the 10 year yields is wrong. If the 10 year yield continues to rise from here, then gold will fall below $3900 and the current move higher is a false move to trap longs. This is why we are cautious on extreme long positioning on gold.
I listen to a lot of podcast and one of my favourite economics guy is Mike Green. He is a brilliant thinker and i recomment you all follow him for his views on passive investing. But he talked about how the government buying the longer dated bonds which are selling at 50 cents to the dollar by issuing the shorter dated treasuries means that the overall government debt could be reduced. So Bessent who has been critisized for doing this, is actually doing the right thing. He is taking advantage of the market mispricing to reduce the overall debt of the government. Something to ponder about.
All analysis done in good faith and not investment advice.
May the Peace of the Lord be upon you all
