Weekend Nasdaq analysis, bond yields and why UK will cut rates aggressively:
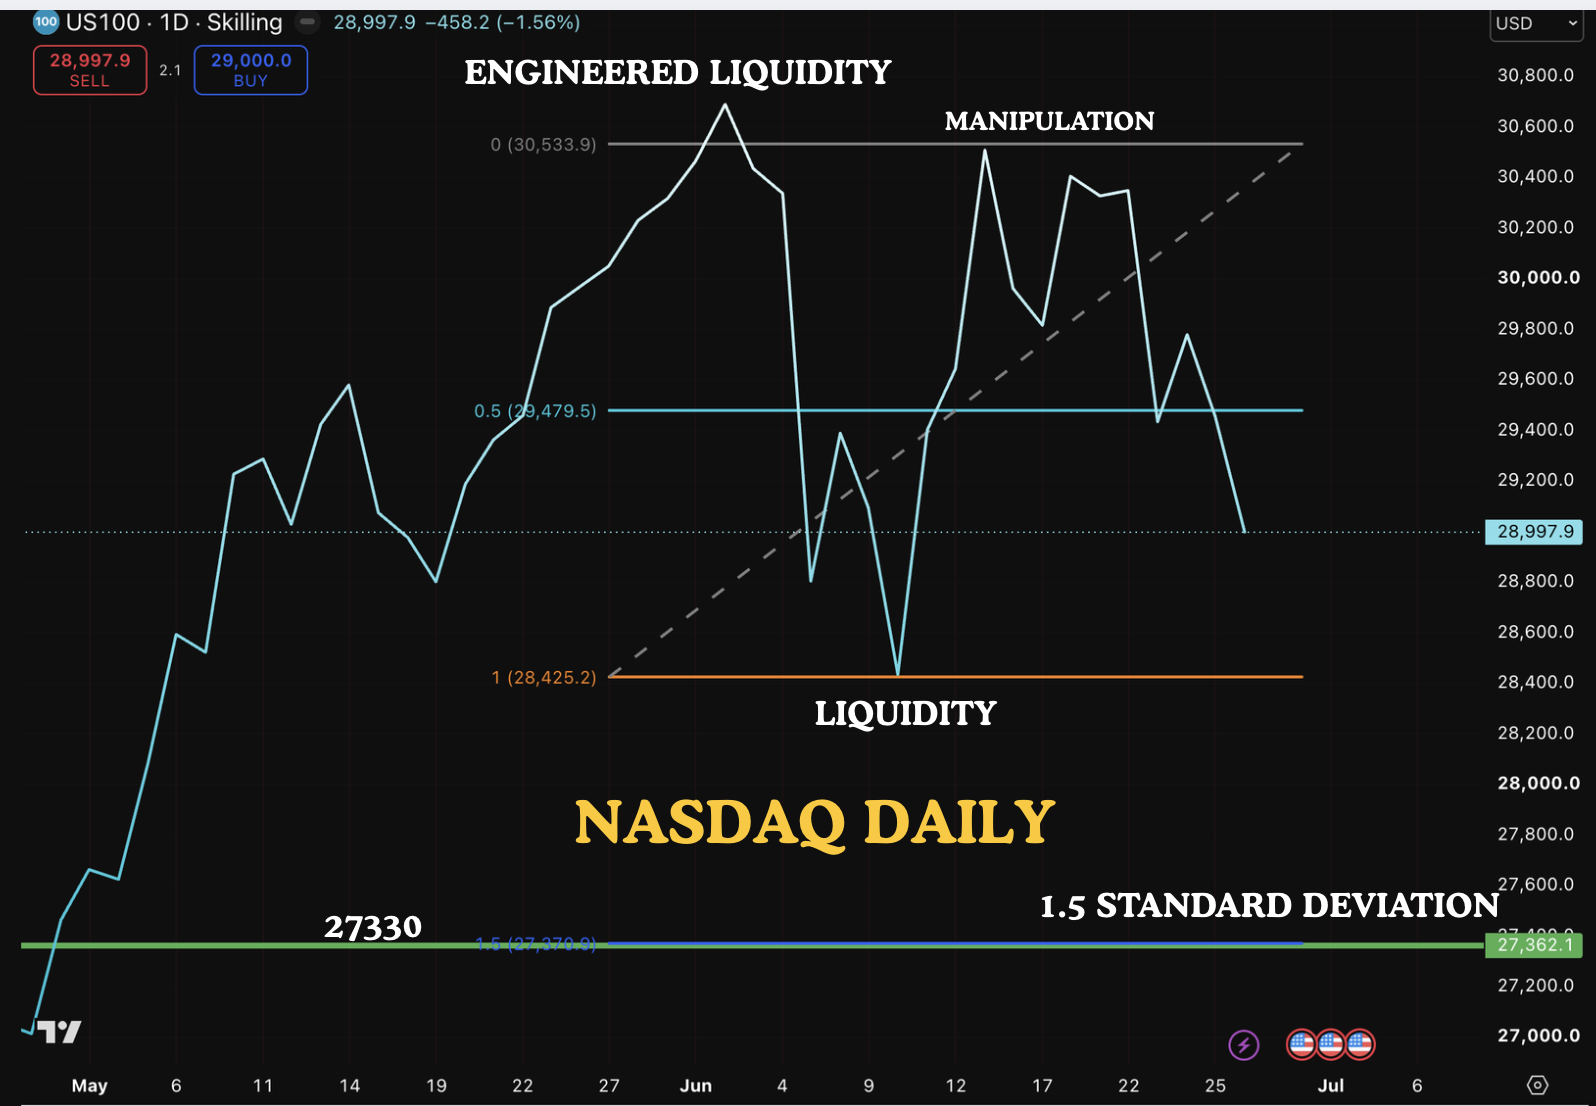
This is the daily chart of Nasdaq. We have had an unprecedented rally in April and May in anticipation of the Space X IPO. And since then price has been range bound with no real key drivers. The semiconductor stocks are very overbought and NVDA is showing weakness. The MAG 7 which we were expecting strength in did not do well either and so the price had an initial sharp correction, followed by a strong rally which we think is most likely manipulation. The price did not take out previous high and the market makers have engineered liquidity at the highs which will be taken at a later stage. However we think that price is most likely to be range bound so that the market makers can accumulate positions and they can then move the market down below the last lows. The price will then me moved higher to make new all time highs by the time of the midterm election.
Even a 1.5 standard deviation move would get price down to 27330 which is about 1600 points below. A two standard deviation move would feel like the whole world is collapsing and we hope that this is not the case. this is just our expectations and we will change the views depending on market action. We do not hold onto one particular bias when the market has disproved our bias.
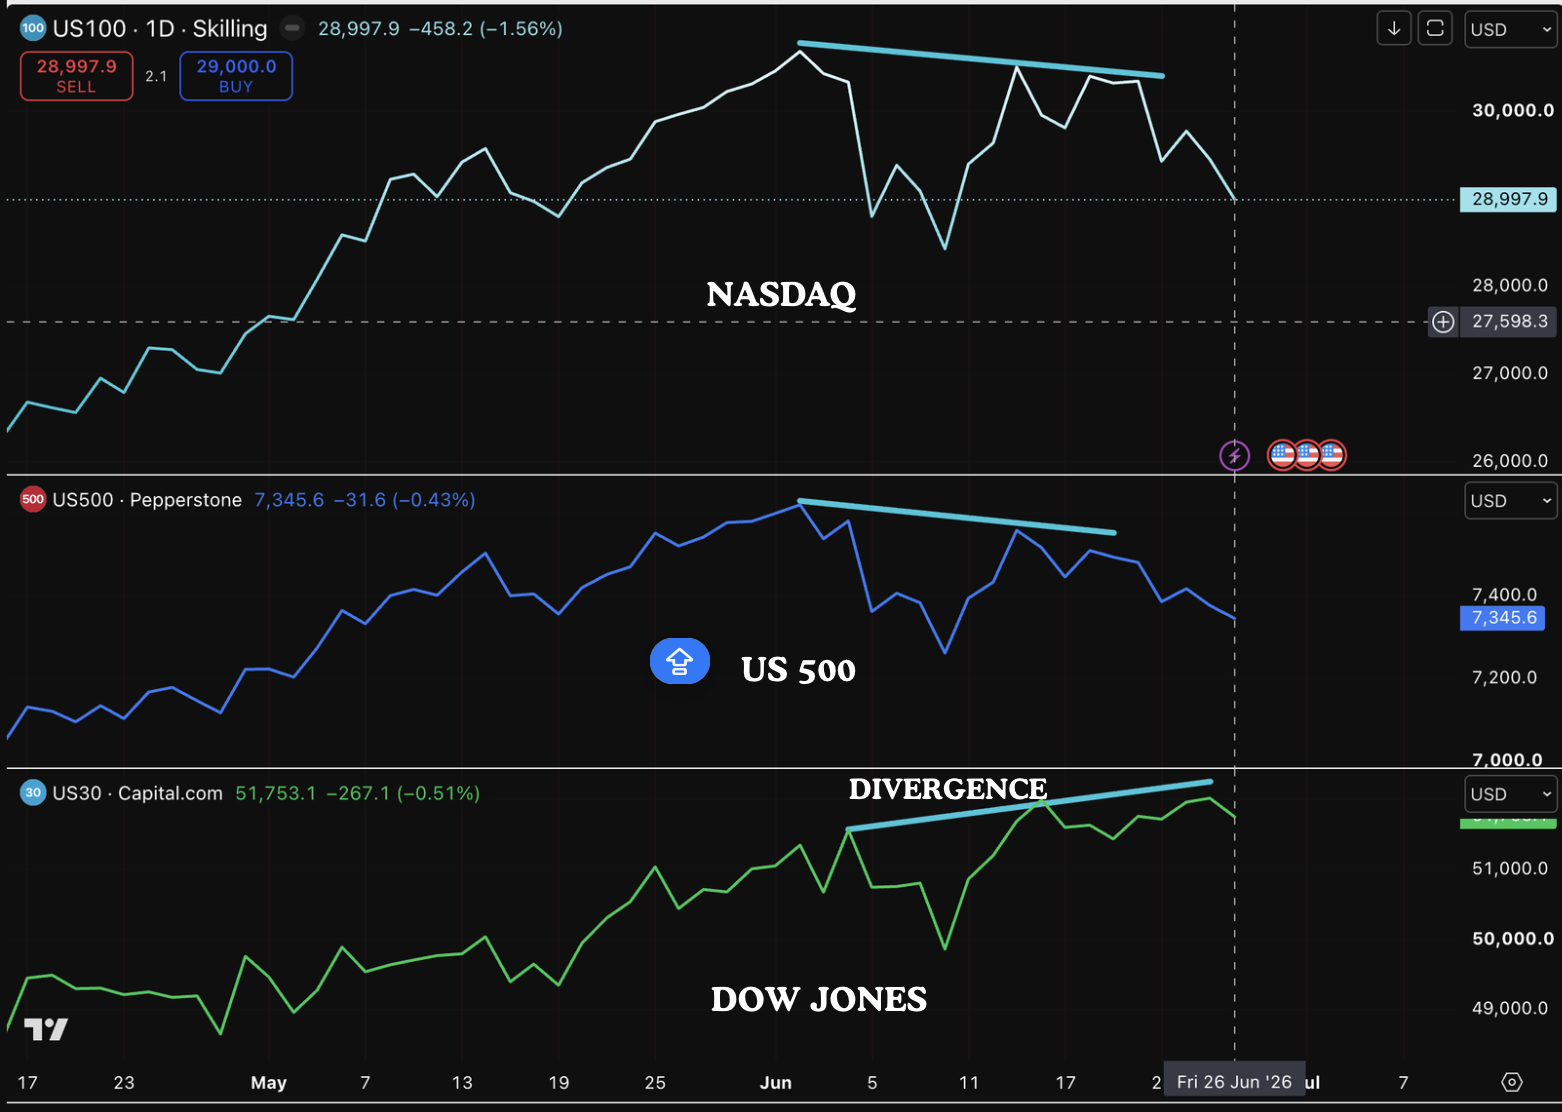
This chart is comparing the daily chart of Nasdaq, S&P 500 and Dow Jones. We can see subtle weakness in both Nasdaq and S&P 500 with both making lower highs. There was underlying distribution going at the second leg higher and investors should look at their portfolios and reduce or close positions on stocks which have done incredibly well but now have broken the 50 day moving average.
we think that the next rally will led by a different group of sectors rather than the Semiconductors. If you have been following us, a few weeks ago we shared our strategy for the next 6 months. Among them were the MAG7 stocks, XLV, IGV and the REITS. We have positioned the model portfolio based on this and we think that the current price action favours our strategy.
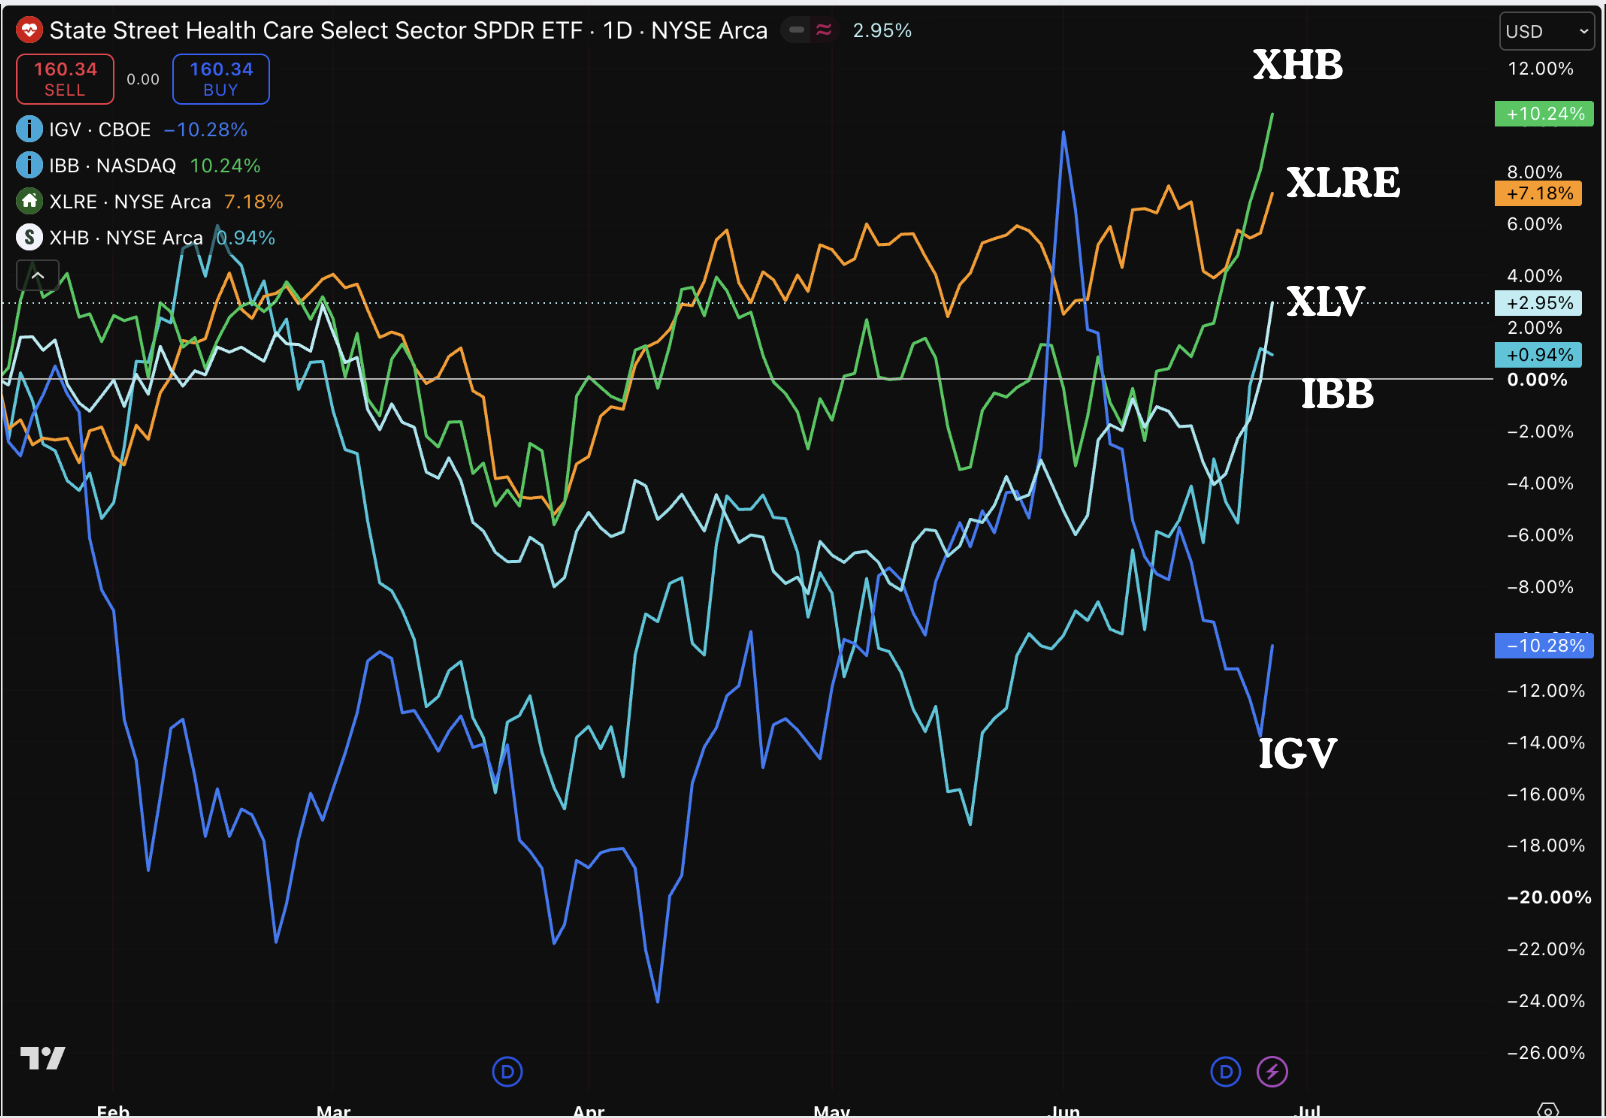
The cahrt compares the S&P sectors and the sector that are currently doing well are the homebuilder, REITS, IBB and XLV. IGV although showing weakness has not made a lower low and we think that this was manipulation and the price will start to rally again. All these stocks are sensitive to interest rates which is falling very fast just like we expected. See prior posts on the 10 year yields.
The 10 year yields and why we think that UK will cut rates aggressively?
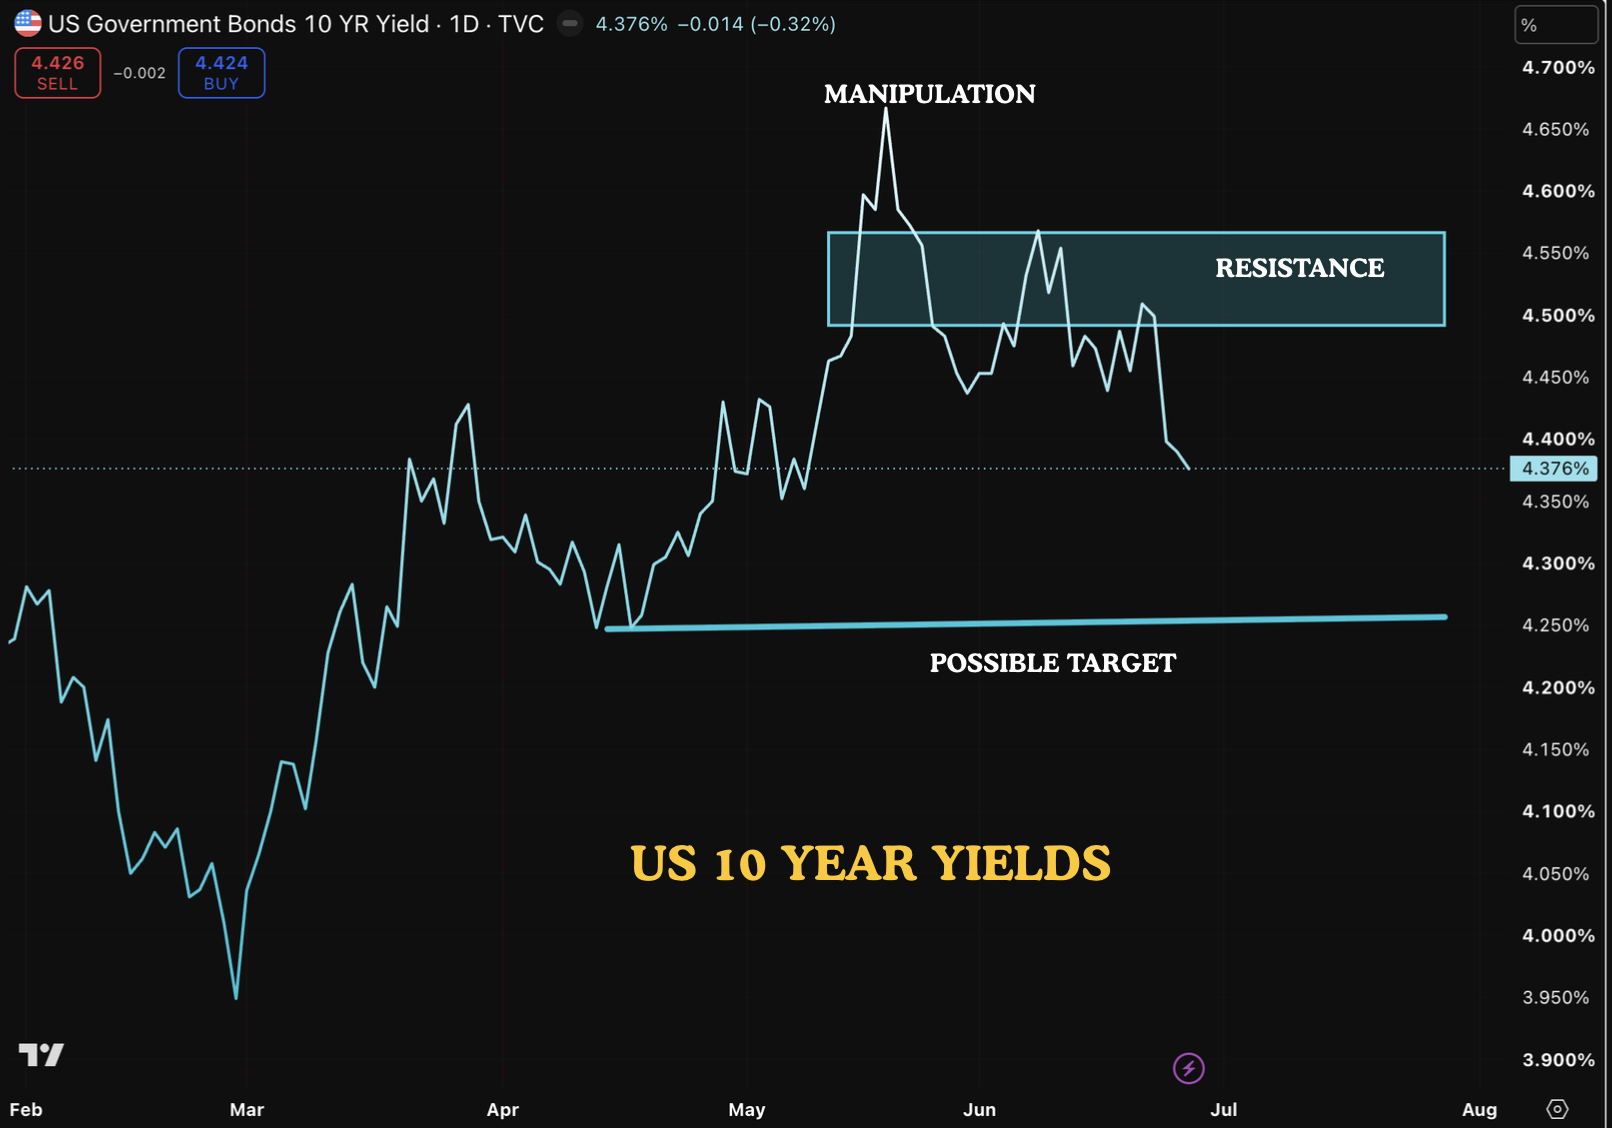
Here is the chart of the 10 year US government bond yields. The price rallied very hard after the war in the middle east and since the temporary peace agreement oil prices has sold off hard and this has resulted in the yields also falling. The current chart suggest that the price is likely to test the target by the november mideterm elections. This will be good for the economy overall and also cut US government interest bill.
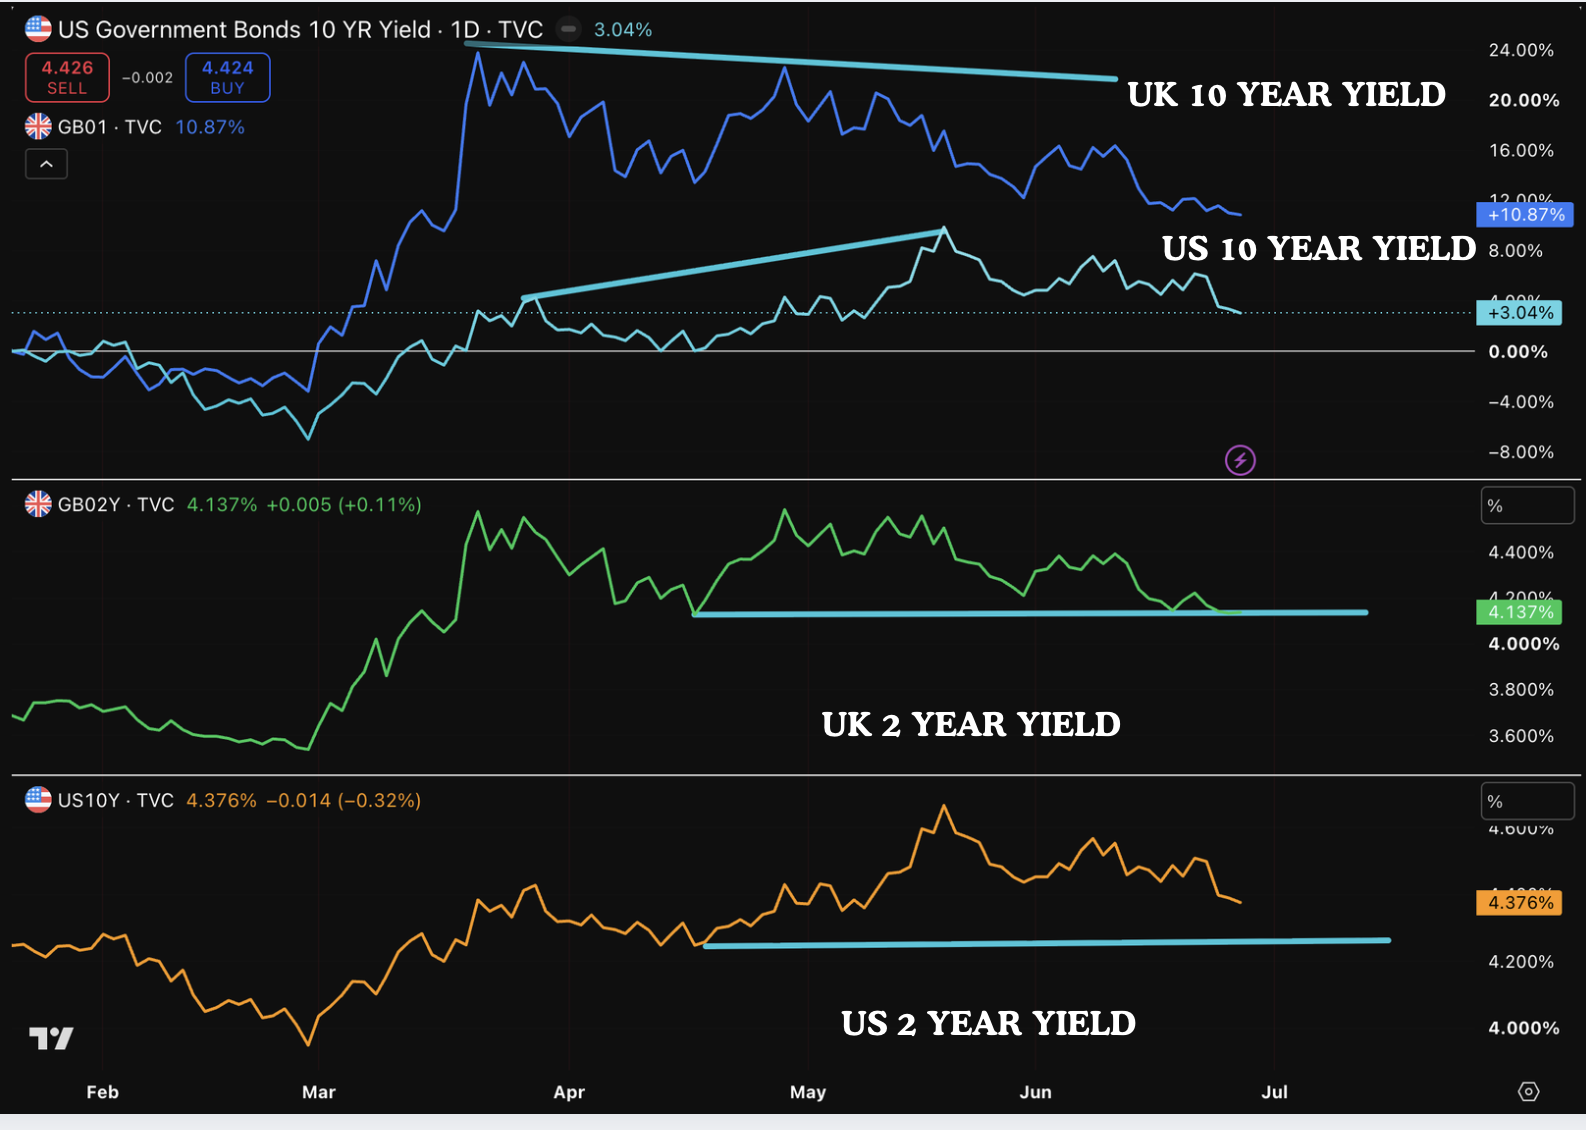
This chart compares the US and UK 10 year yields and the 2 year yields. As you can see, even when oil prices were high the UK yields were falling and this suggests significant weakness in the UK economy. . The other way to look at this would be that the 10 year US yields were manipualted higher. We will never know but the 2 year yields are suggesting that the UK 2 year yield is about to make a lower low and once that happens, the yields are likely to fall hard and result in the BOE to cut interest rates aggressively. UK investors should seek shelter in Swiss Franc or the US dollar assets. If we compare the US 2 year yields, the price is much higher compared to previous low. Usually when the yields are falling it suggests underlying economic weakness so although we like Rio Tinto a lot we will reduce position size in the portolio and increase allocation to the REITS. These are the biggest beneficiaries of the falling yields. They have underperformed for the last 5 years.
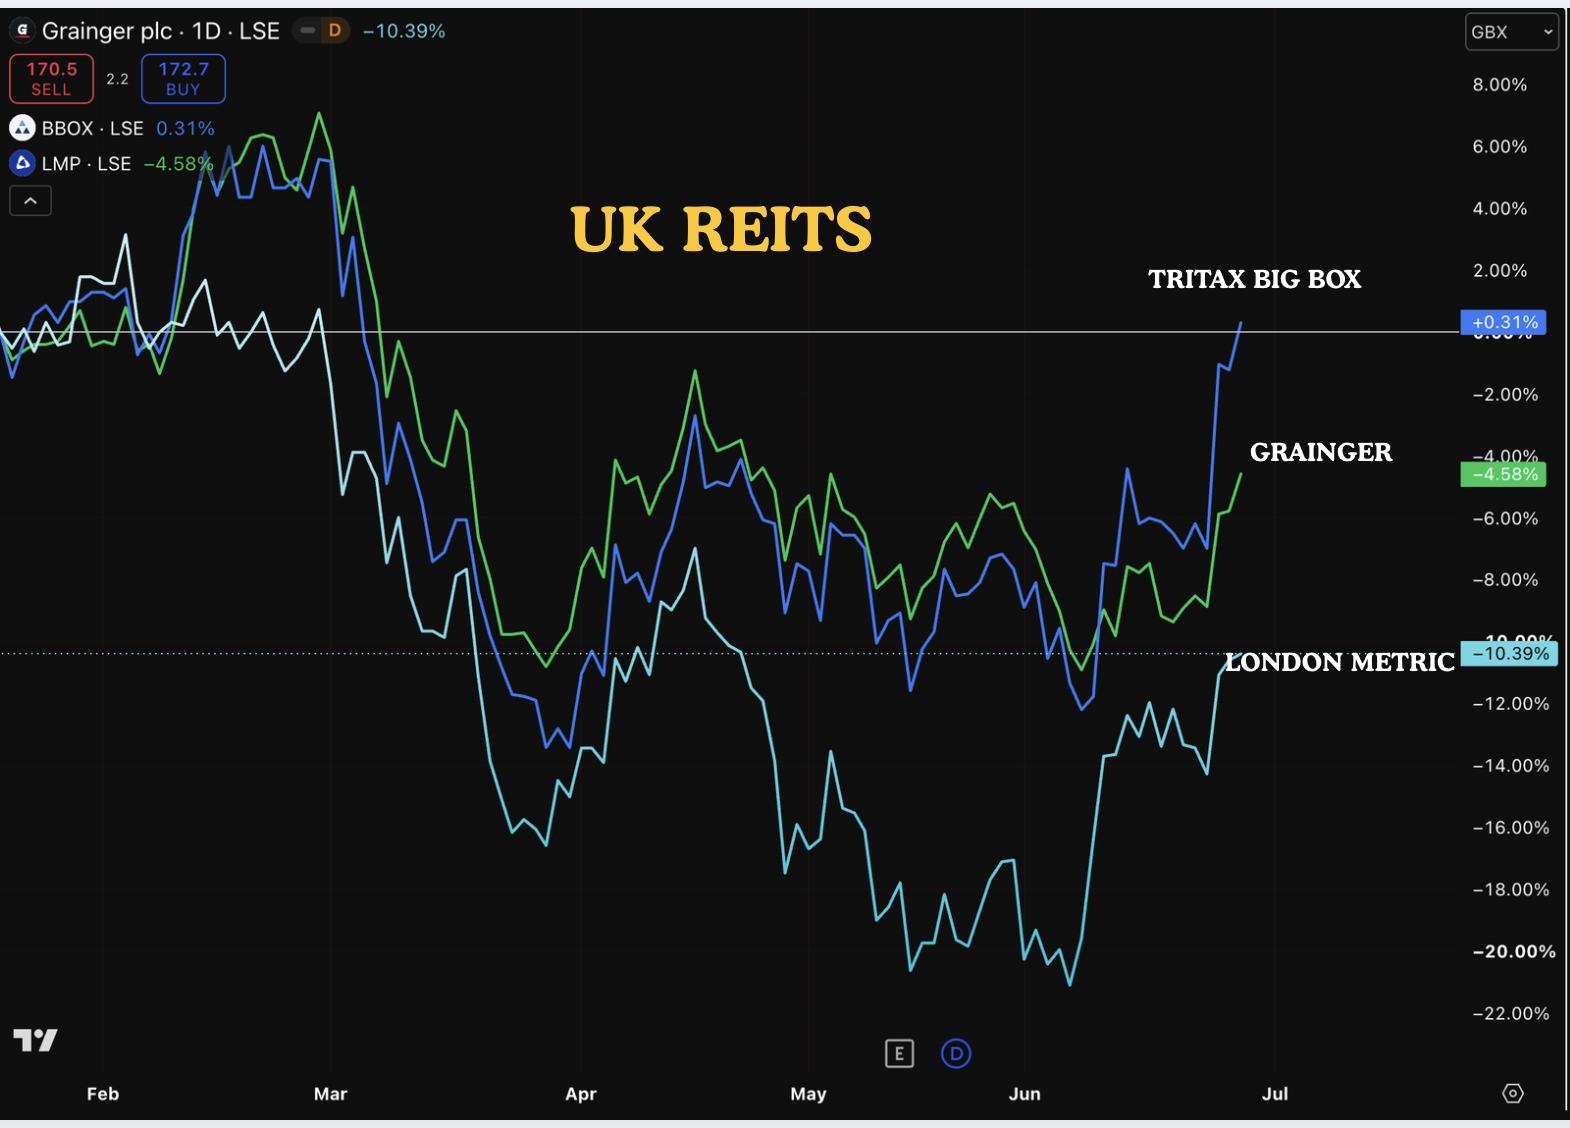
A few weeks ago, we did a newsletter covering UK reits and said that it would be the most asymmetric trade with very high yields and trading at discount to their net asset value. Our thesis may be proved right as the REITS are showing relative strength inspite of the sell off and going higher. in our view, Grainger has most to rise as it is trading nearly 30% below net asset value. London Metric properties give you the most dividend and Tritax big box shows the most strength because of its AI data centre exposure.