Nasdaq weekend analysis: 20/6/2026
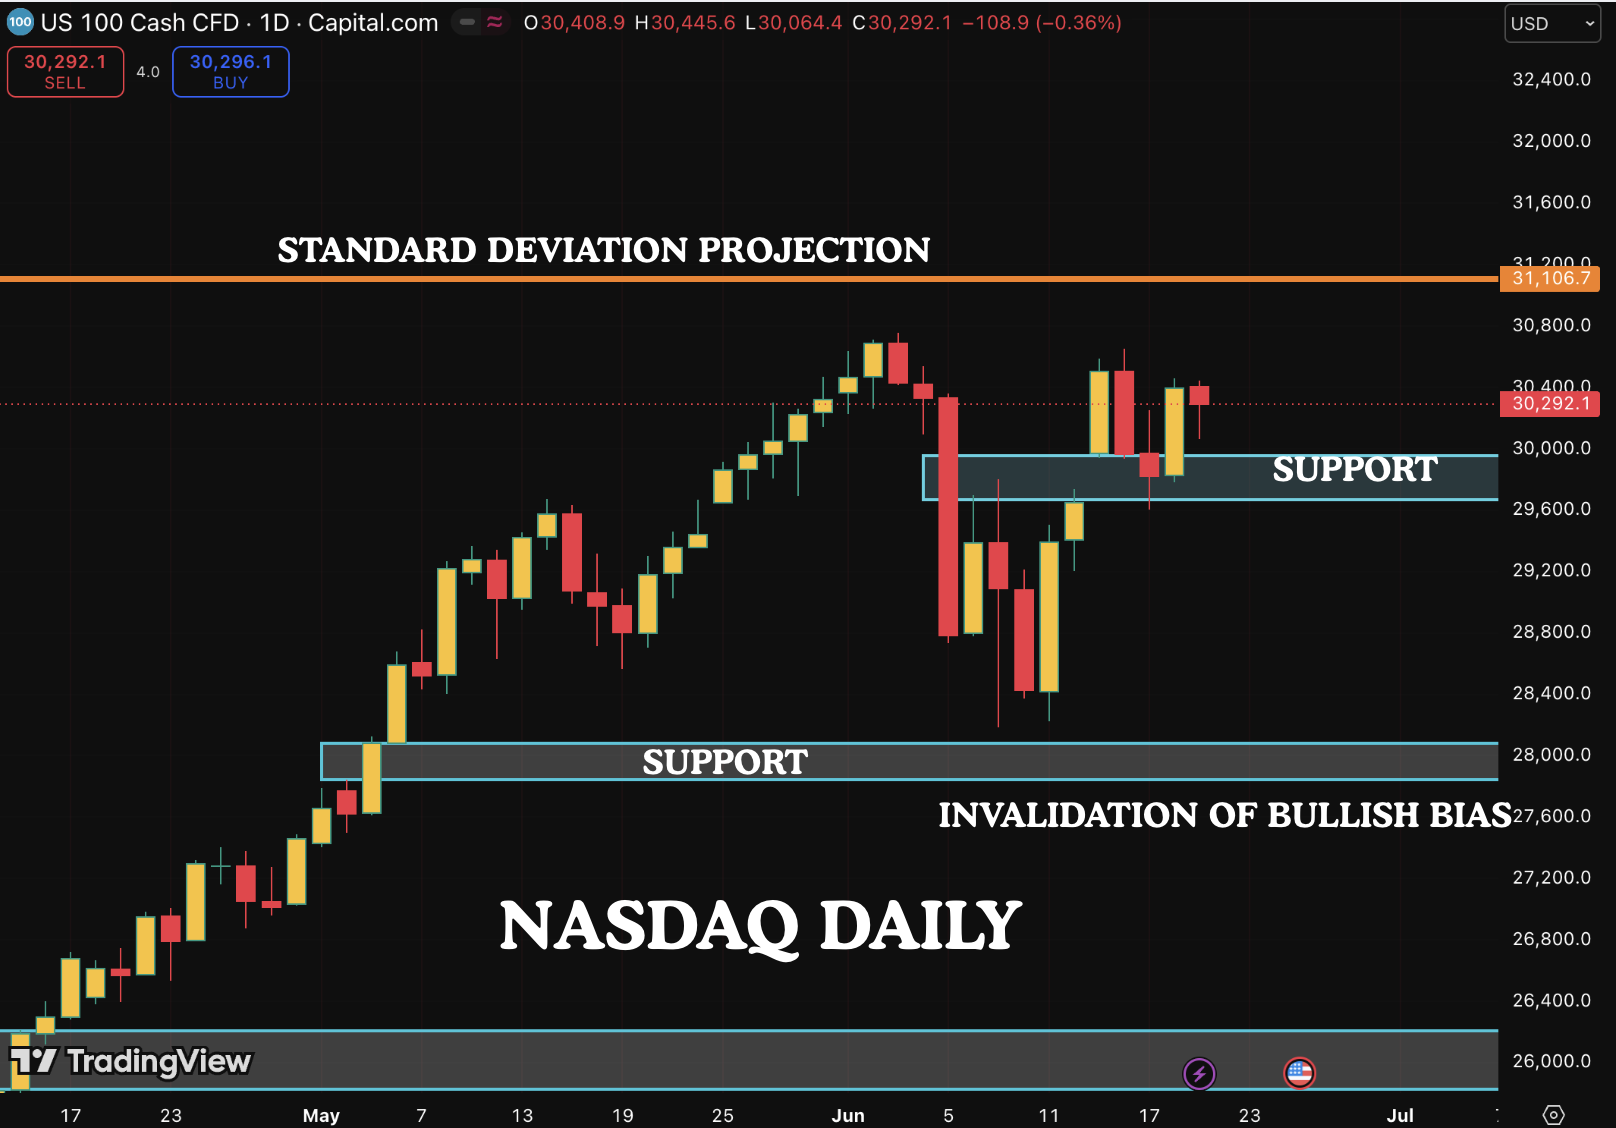
Here is the daily chart of Nasdaq. We are in a strong bull trend and price has retraced after touching 30,000 level. The price has held the first line of support and has bounced. Considering the strong momentum, we should maintain a bullish bias and should only look for longs. The price can however retrace and test the 2nd support and can still be considered bullish. In this case, we can say that the market is working off its overbought position by sideways consolidation and this would be good for further move higher later on. We are still maintaining a potential target of 33,000 before the midterm election. We will only change this bias if price goes below the second support.
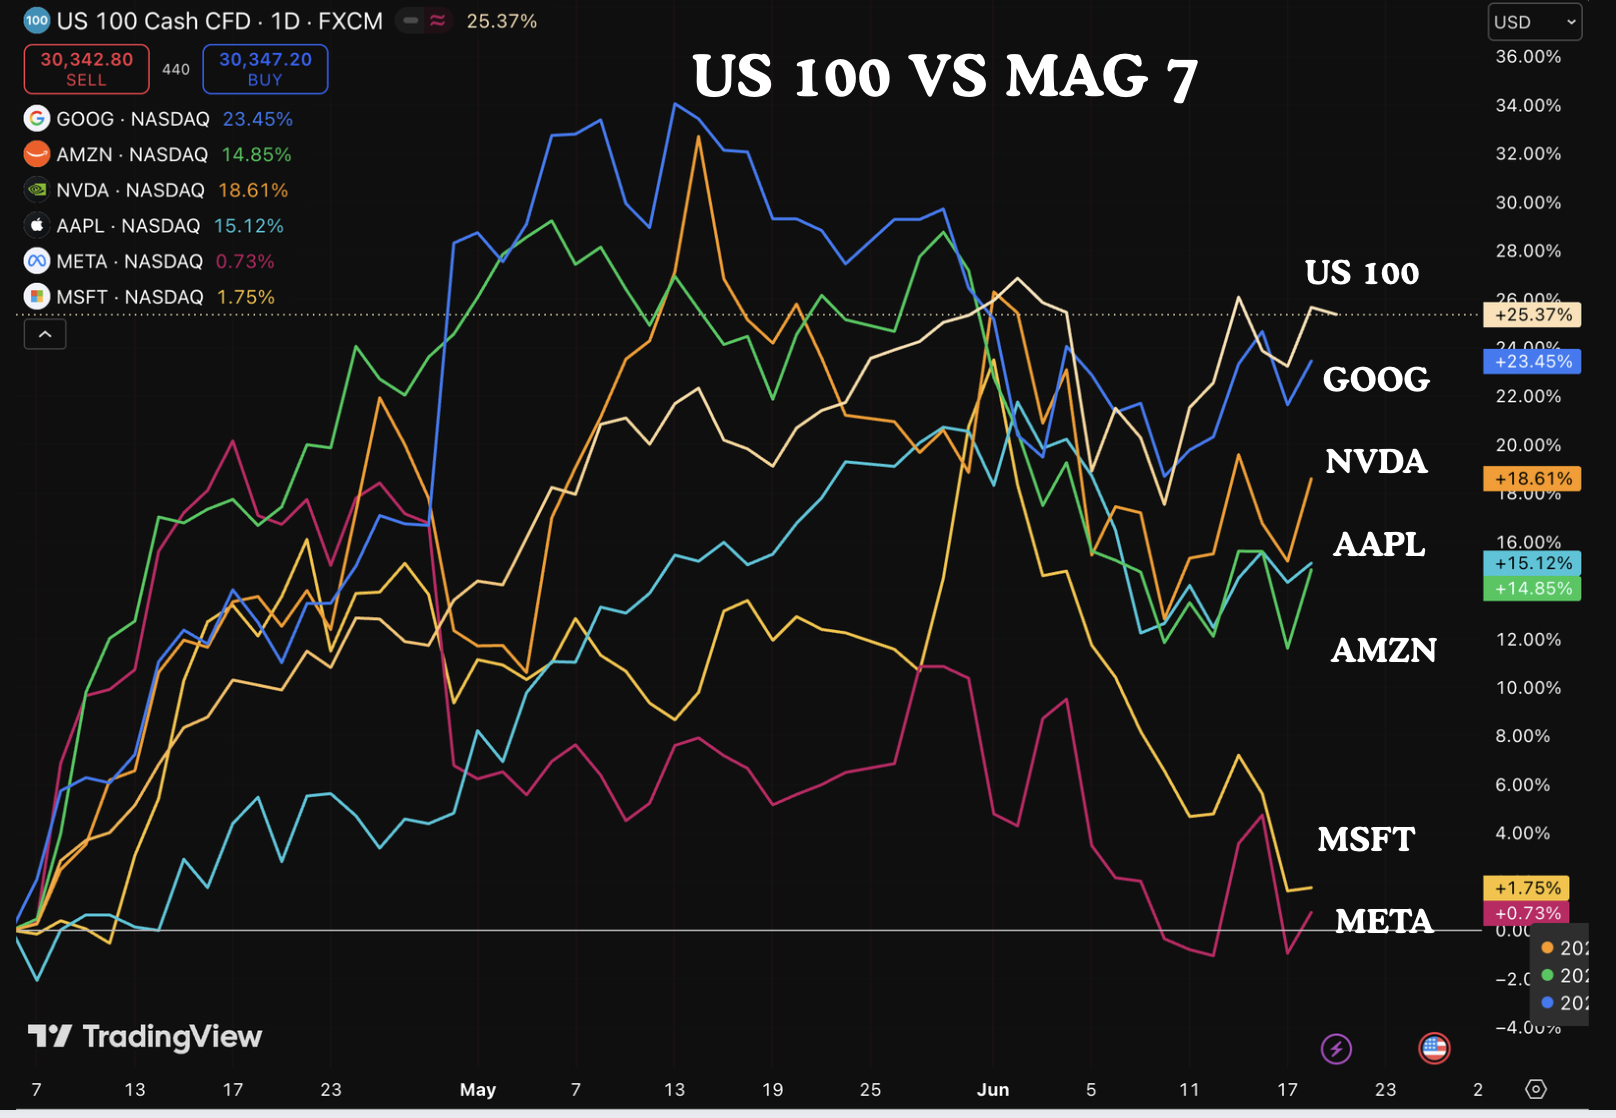
The above chart compares the US 100 and MAG7. We can see that all the companies are underperforming the broader market. If we were to see further rallies in the market, then we need some strength in the MAG7. If they continue to be weak then price can potentially test the lower support. If you look closely, NVDA, META and AMZN have turned up. So if we see strength in these stocks then price is likely to make new highs on the Nasdaq.
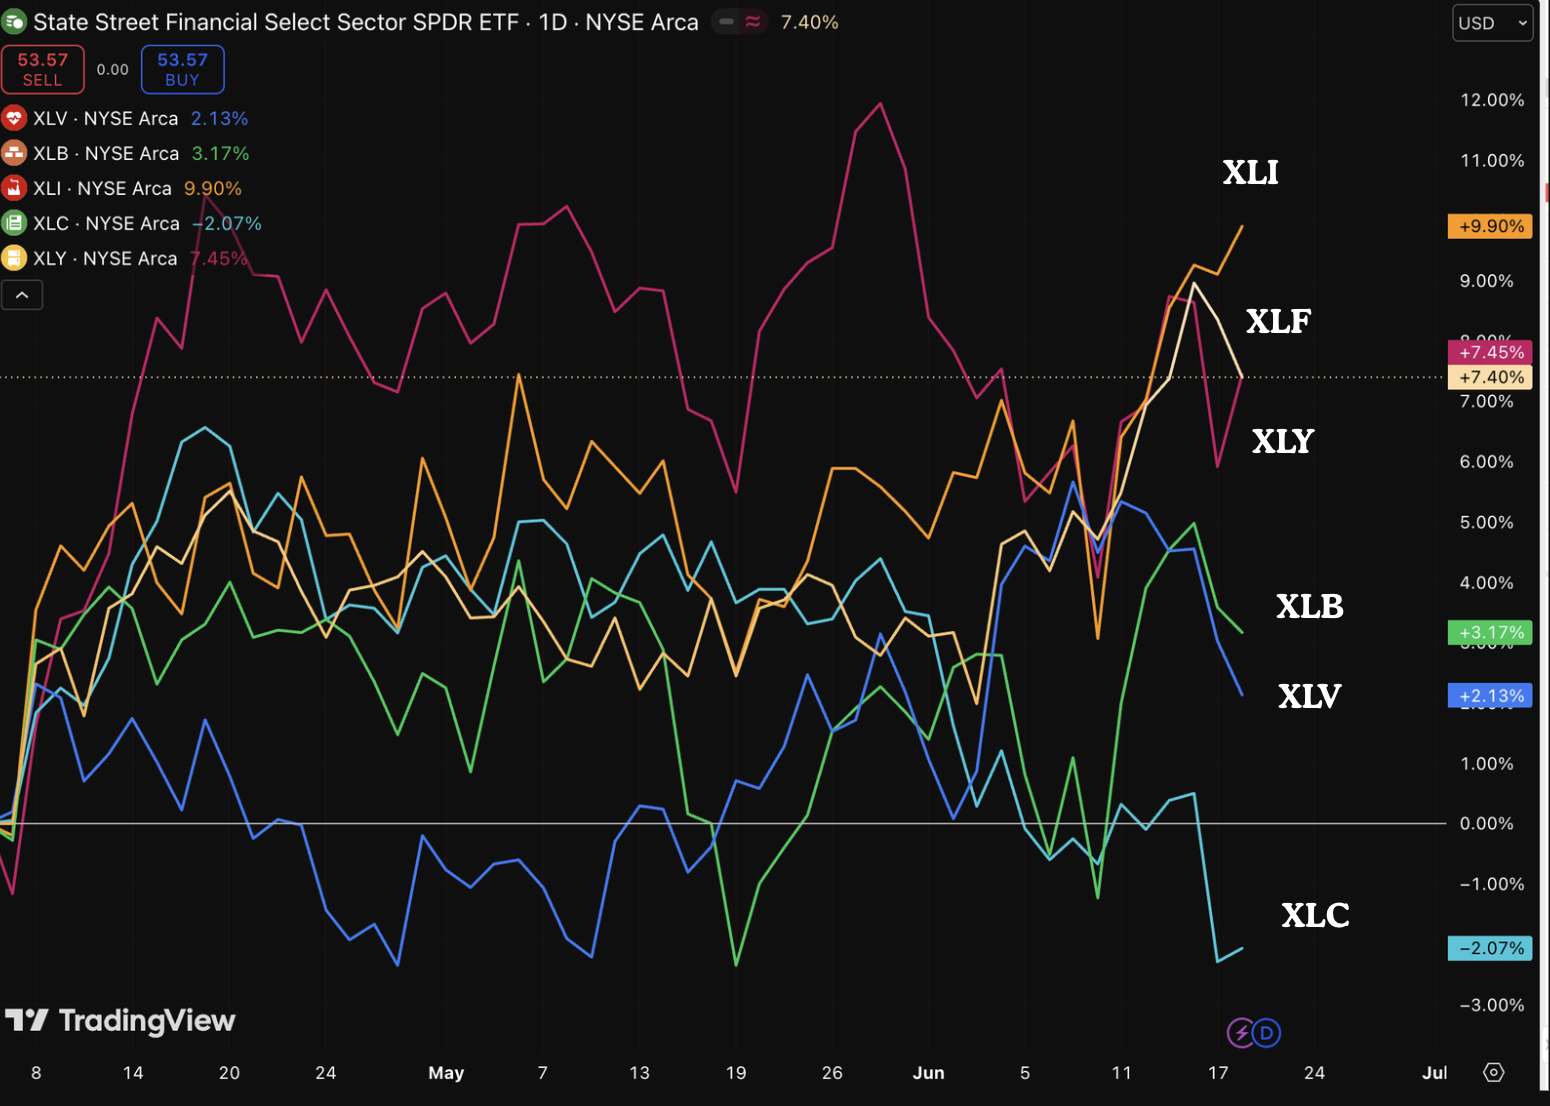
Finally a look at all the S&P 500 sectors. We have excluded XLP and XLK. The leading sectors after XLK are XLF and XLI. So investors should concentrate on these stocks. At Muffett investments, we are big on XLV and XLB. They are currently underperforming but hopefully they will catchup. The underlying trend is still bullish.
All analysis done in good faith and is for educational and information purposes only.