NASDAQ analysis 21/11/2025:
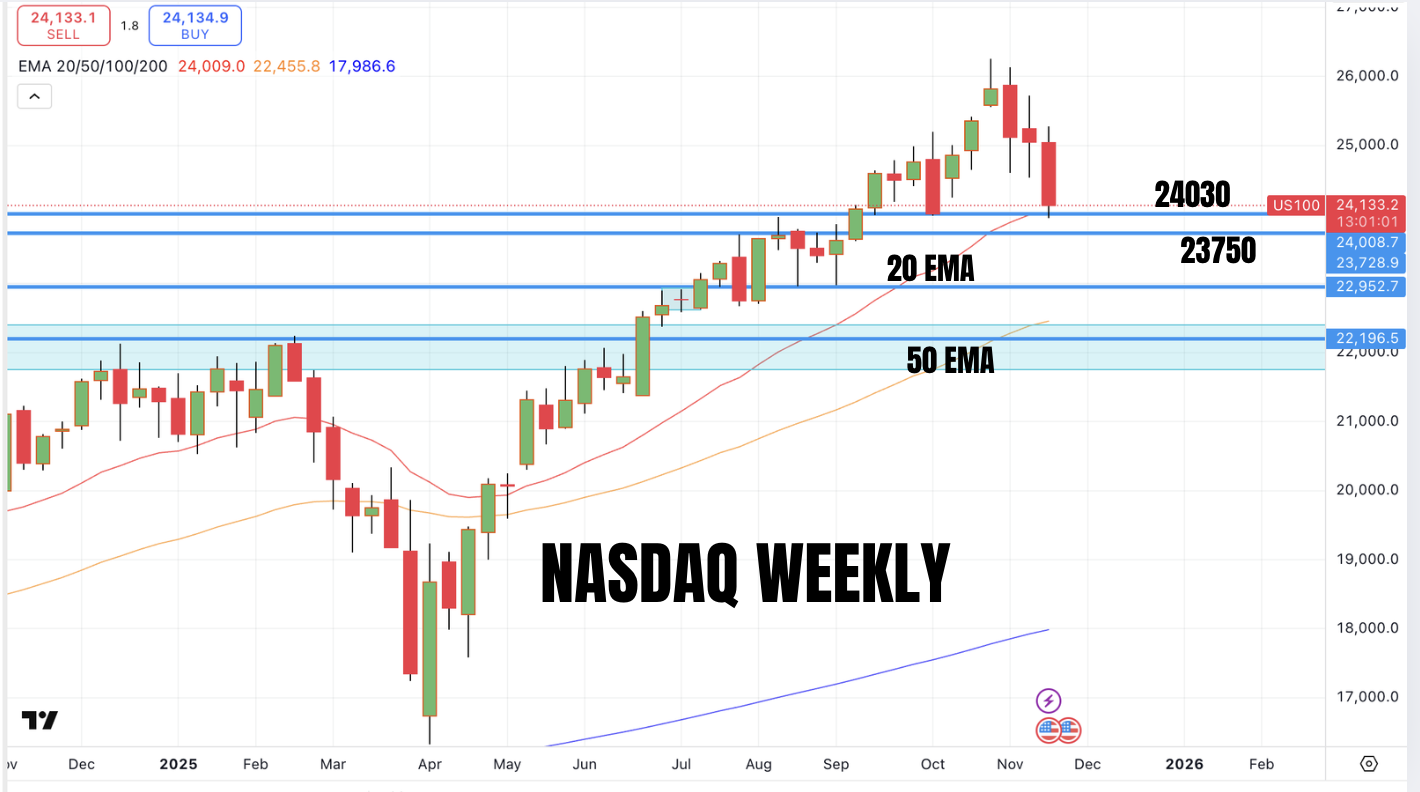
This is the Nasdaq weekly chart. As you can see after bottoming in April, the index moves above the 20 week moving average in May. For the next 6 months, the price has never touched the 20 week Moving average. This is a bullish sign and so we argue that the first time it touches the price average, we can expect a bounce atleast. Also if you look at the lines 25030 is a previous weekly low. The price goes below this to grab the liquidity here. Now this is important. If price can close above 24030, then in our view, atleast the short term is bullish. we would consider this move lower as a liquidity purge and look for long opportunities as long as the current lows printed at 23950 level is not violated. So we will be watching how the price behave after the New York session opens and we should see a strong rally in price. if this happens, and the price never goes below the opening price low of the New York session, we would consider it a bullish behaviour of the market.
Obviously there is no certainty in the markets. The price action should confirm our premise. If the price action behaves in a way which is bearish, we have to accept that we are wrong and be willing to change the bias.

The above is the daily chart that we have shared in the past. Our best buy zone is the one down below. But it is our premise that the Trump administration will never let the price to come down to the best buy zone. It is important to remember that our premise could be wrong and we have to make judgement calls as to whether we buy stocks at the buy zone or the Best buy zone. At Muffett investments, we will enter into some positions in the buyzone and add to the positions in the Best buy zone if price does come to this zone.

At Muffett investments, we have a list of stocks that we keep on our watchlist. We do our proper due diligence and then we wait. We wait for correction in the overall indices and then we buy into those stocks that are showing relative strength. The stocks which are showing relative strength are the ones that will be above the index and the stocks showing relative weakness will be below the index line. Here Exxon and Amazon are below the Nasdaq line and show relative weakness. The stocks showing strength will outperform usually. Offcourse there are no guarantees in the market and appropriate risk management should be employed. It is important to remember that we do not buy into a stock just because it is showing relative strength. We buy into a stock which we have done research on its fundamentals and we are happy to hold even if the stock corrects.
Based on this above list, Alphabet, Eli lilly, Abbvie, Roche are showing relative strength. We have bought into Alphabet and we are already long on Roche. We will add to these positions if the price comes to the best buy zone. If the overall index comes to the best buy zone, we do a relative strength analysis before engaging again.
Disclaimer: Investing in financial markets is associated with risks. The above is our own view and not investment advice. Please do own research or seek advice.