Gold analysis 27/08/2026
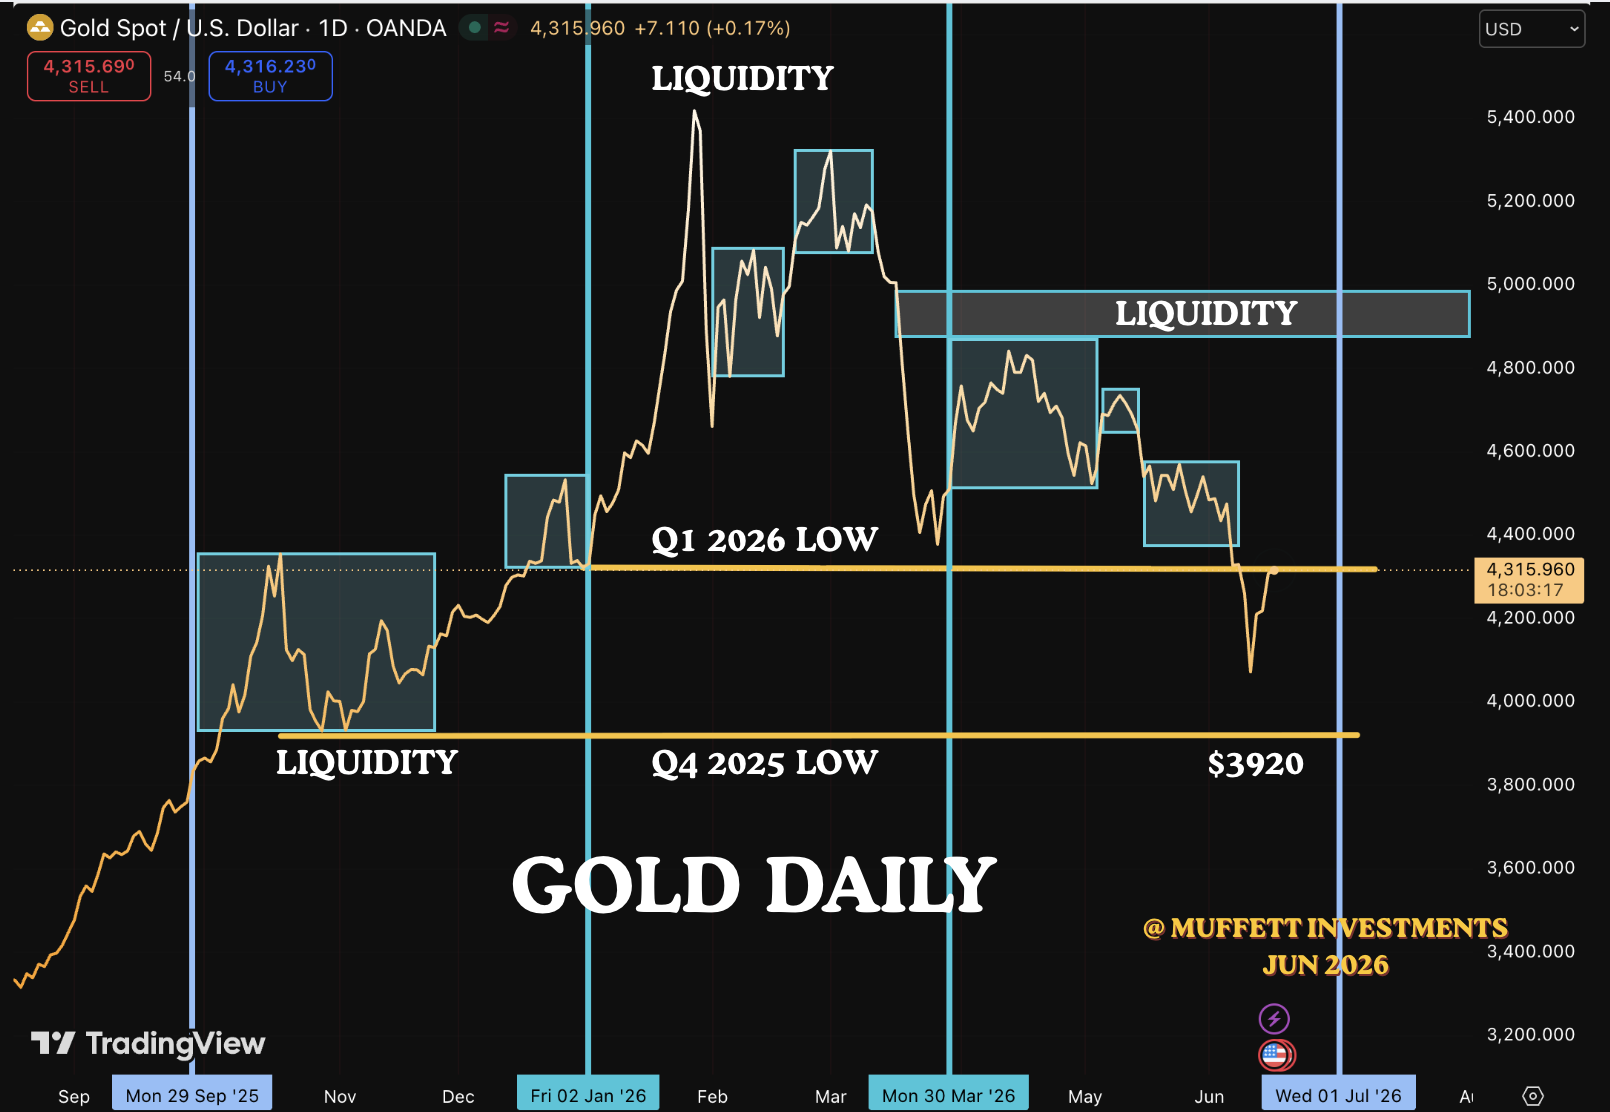
This chart was shared on the 16th of June. At that time we were looking to see if gold could rally back into the range making it a purge of Q1 2026 LOW. But since then price had should significant weakness along with strength in DXY. Until we had some form of peace agreement in the Middle East the dollar was kept in a tight range and once we had a agreement, the price was allowed to rally higher. But we are also seeing falling yields which is bearish for DXY. We have showcased this divergence in an earlier post. we now have a context from which we can look at current gold price action and develop a view or strategy to trade gold and gold miners.
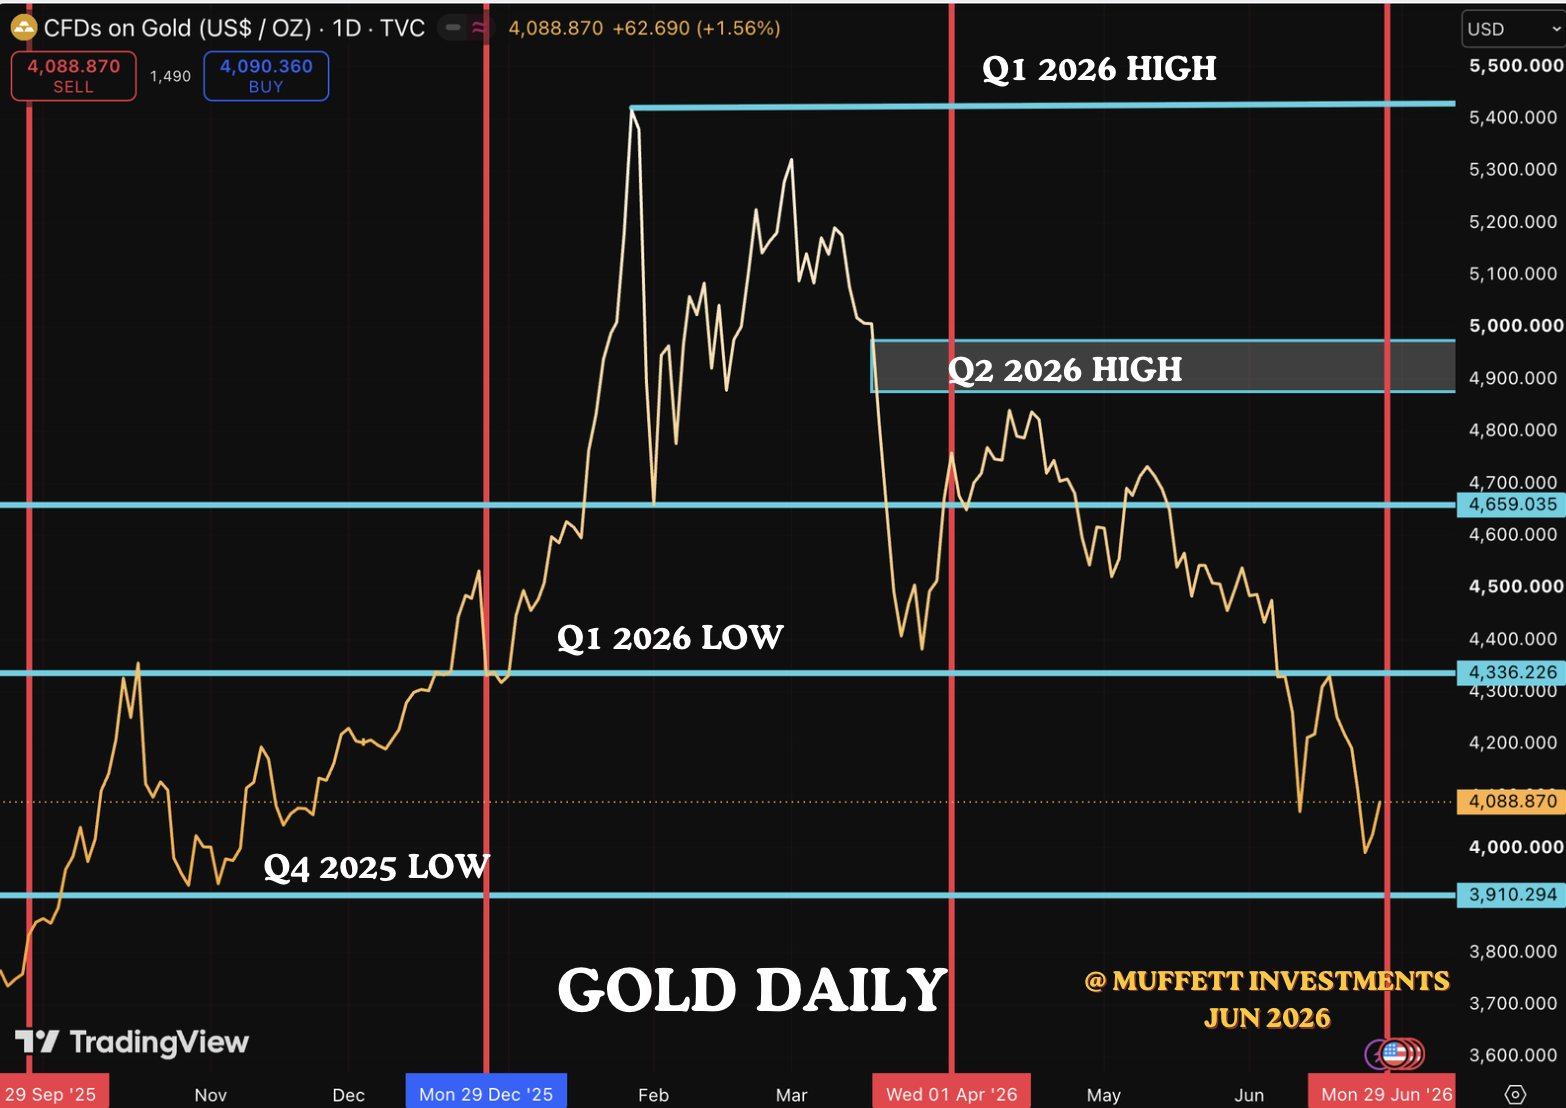
Here is the daily chart again which shows price finding resistance at Q1 2026 low and selling off. As we are very close to Q4 2025 LOW, there is a good chance that price might go below this in the next quarter Q3 2026. This is our current view on gold . The algorithmic price patterns that has currently formed in gold does not inspire a bullish bias. But if price can close above $4355, then we will be convinced of a gold bottom. This does not mean we are bearish on gold. We are fundamentally bullish on gold. We are looking for price action to confirm our bullish fundamental bias. We will be starting a new quarter next week and so we are looking to see if the new quarter begins with a purge of the Q4 2025 LOW followed by a massive rally. We will now have a look at what is happening in silver.
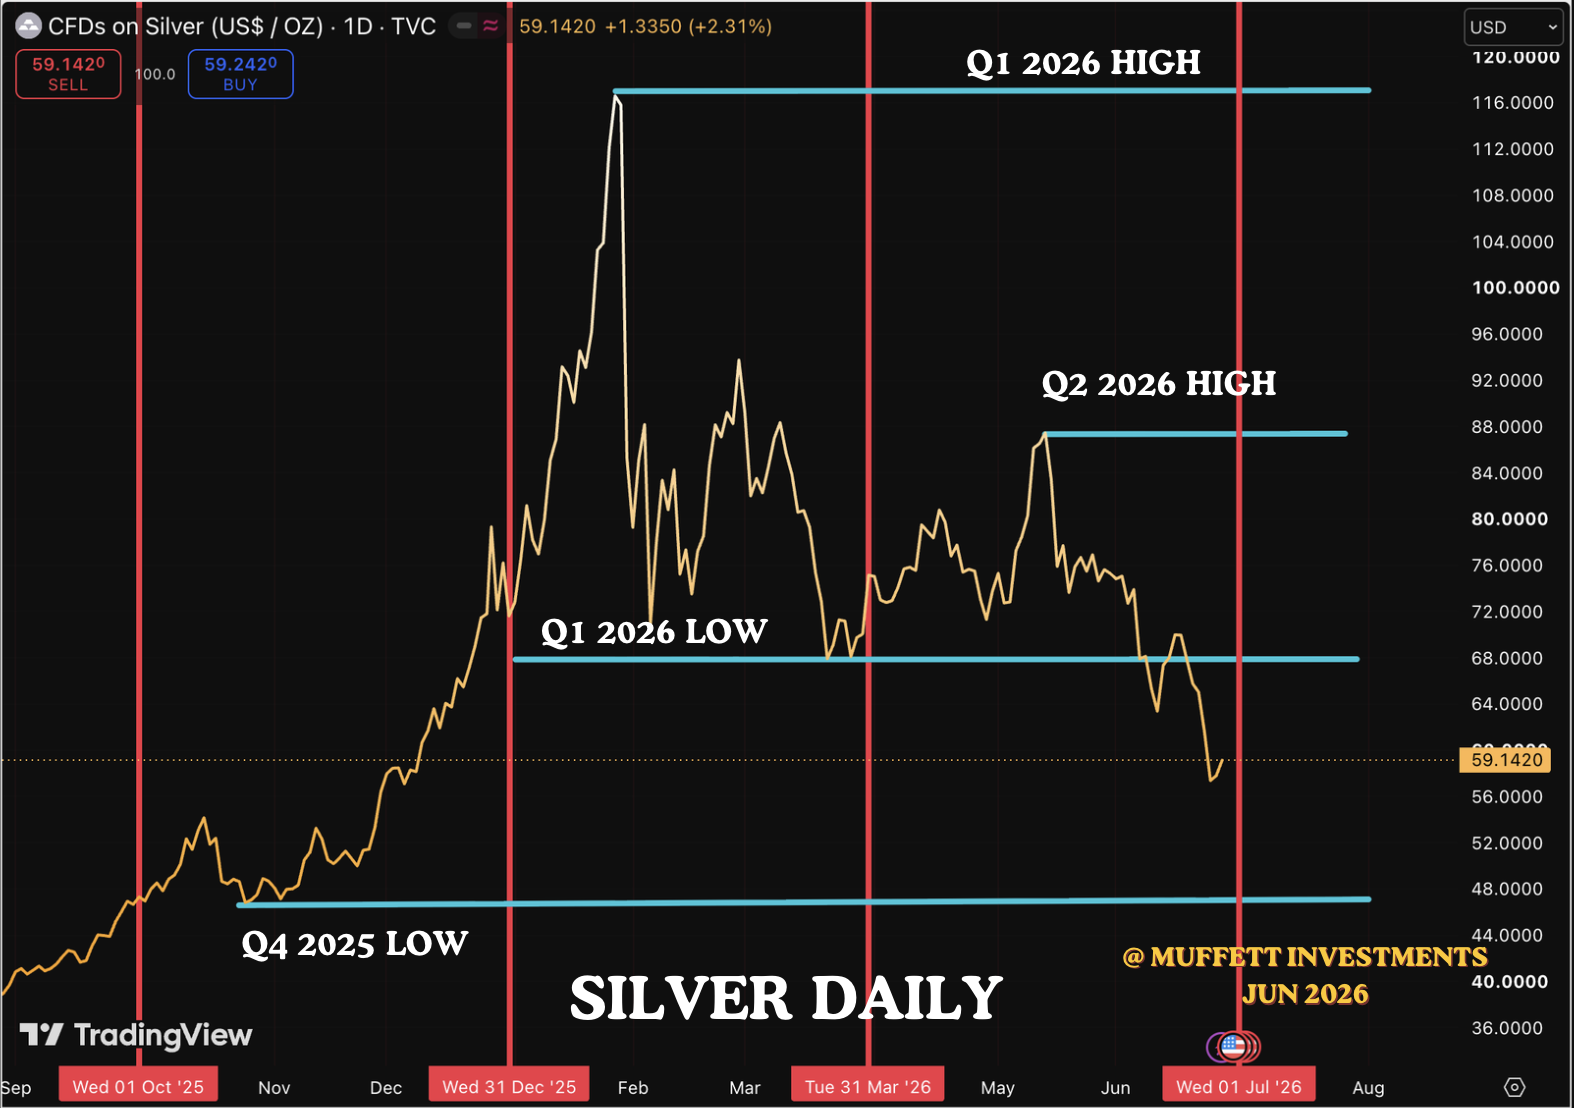
Silver is also showing a very similar pattern to gold. We look at silver chart and compare that with gold to look for divergences on the daily currently we have no divergence. However silver is currently trading much higher from its Q4 2025 LOW than gold. So in the next quarter, we can have purge of Q4 2025 LOW in gold but not in Silver which will create a divergence and this will add to our bullish bias.
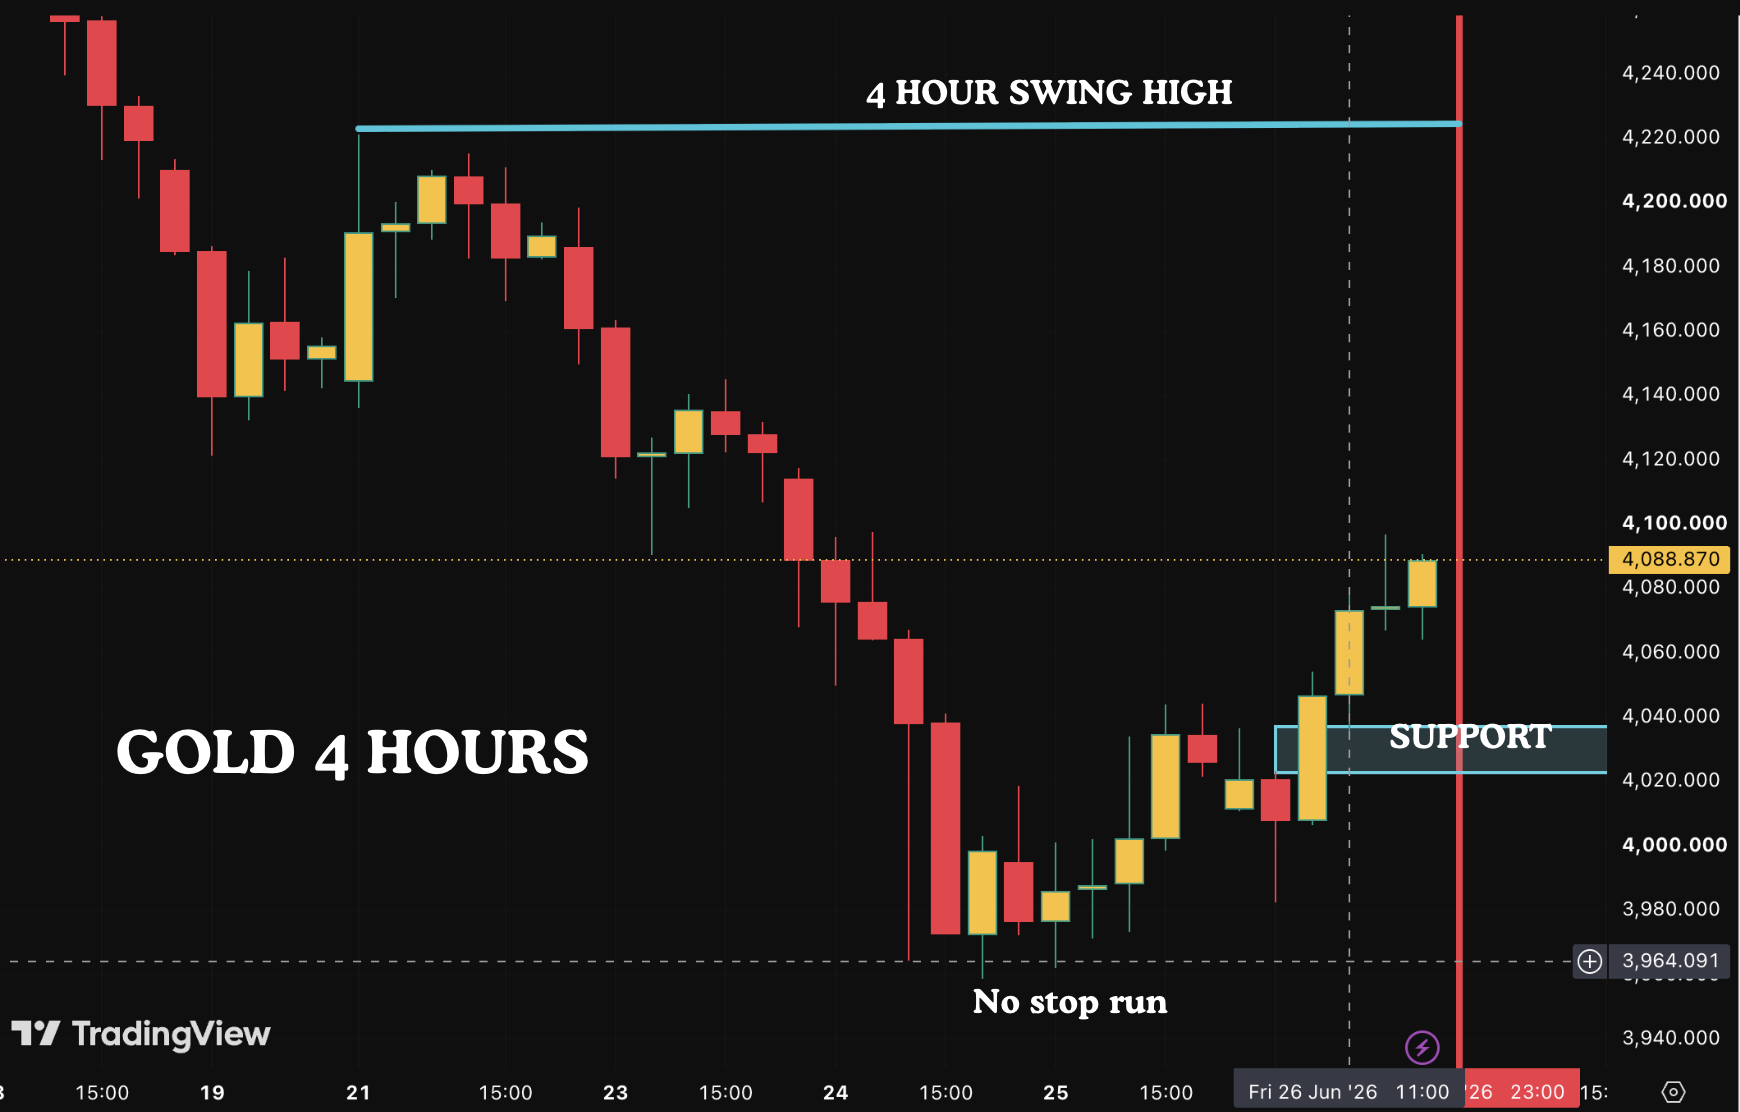
Why are we cautious about the current gold rally? If we see the lows, there was no stop run. Also above key levels such as the Q4 2025 Low, the market makers commonly create a false bottom and induce buyers to take long positions. Once they have enough longs they can aggressively move the market against the longs and go below the Q4 2025 lows stopping out many participants. This is the reason why we are cautious. We will be watching the support zone formed between $4040 and $ 4015. The price should not close below this zone for a bullish bias. If this happens then there is a good chance that price will go below the Q4 2025 LOW at $3920. Short term traders can take shorts with stops above $2040 to target the lows. We are however only looking for longs. so if price goes below the support, we will position ourselves to go long below $3920.
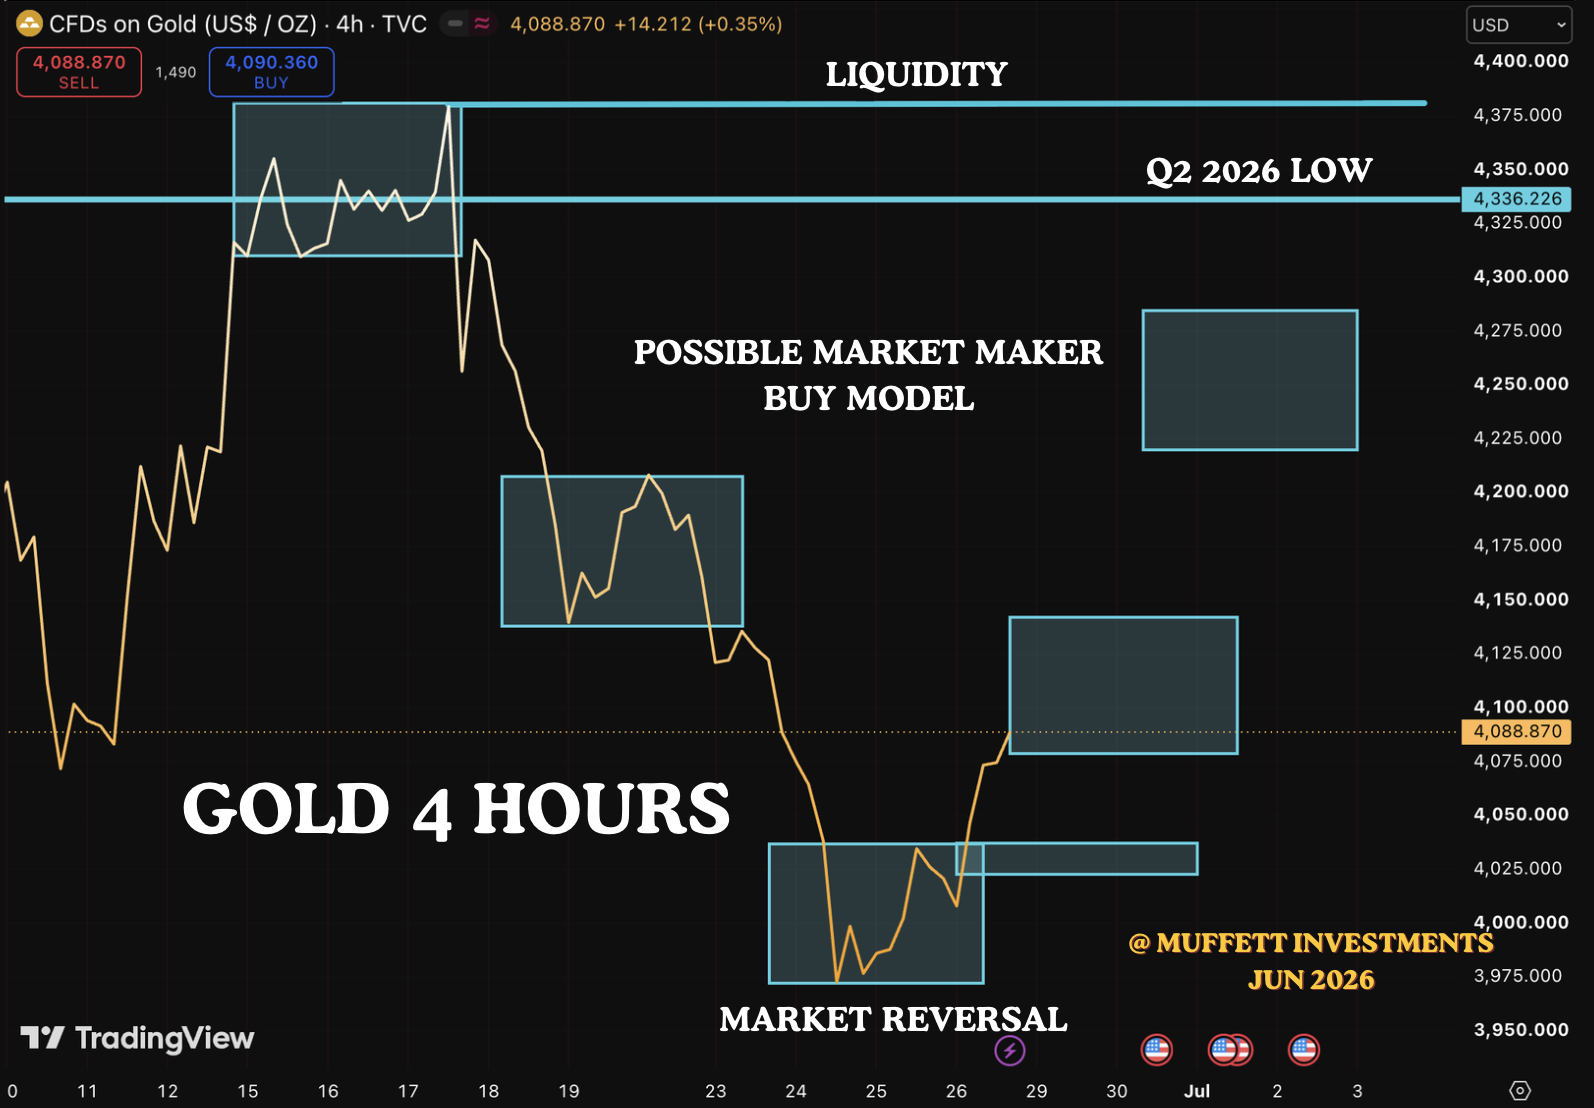
On the positive side, the current price action on the line chart suggests that gold might be in a market maker buy model. For this to be confirmed price needs to move aggressively above the consolidation that happened on the downleg just before the market reversal happened. This would be around $4208.
These are just expectations and possibilities and ultimately we have to be guided by the price action. So let our bias be guided by it.
All analysis done in good faith and is for educational purposes only and not investment advice.
May peace be with you all.