DXY analysis and intermarket relationship and quarterly purges
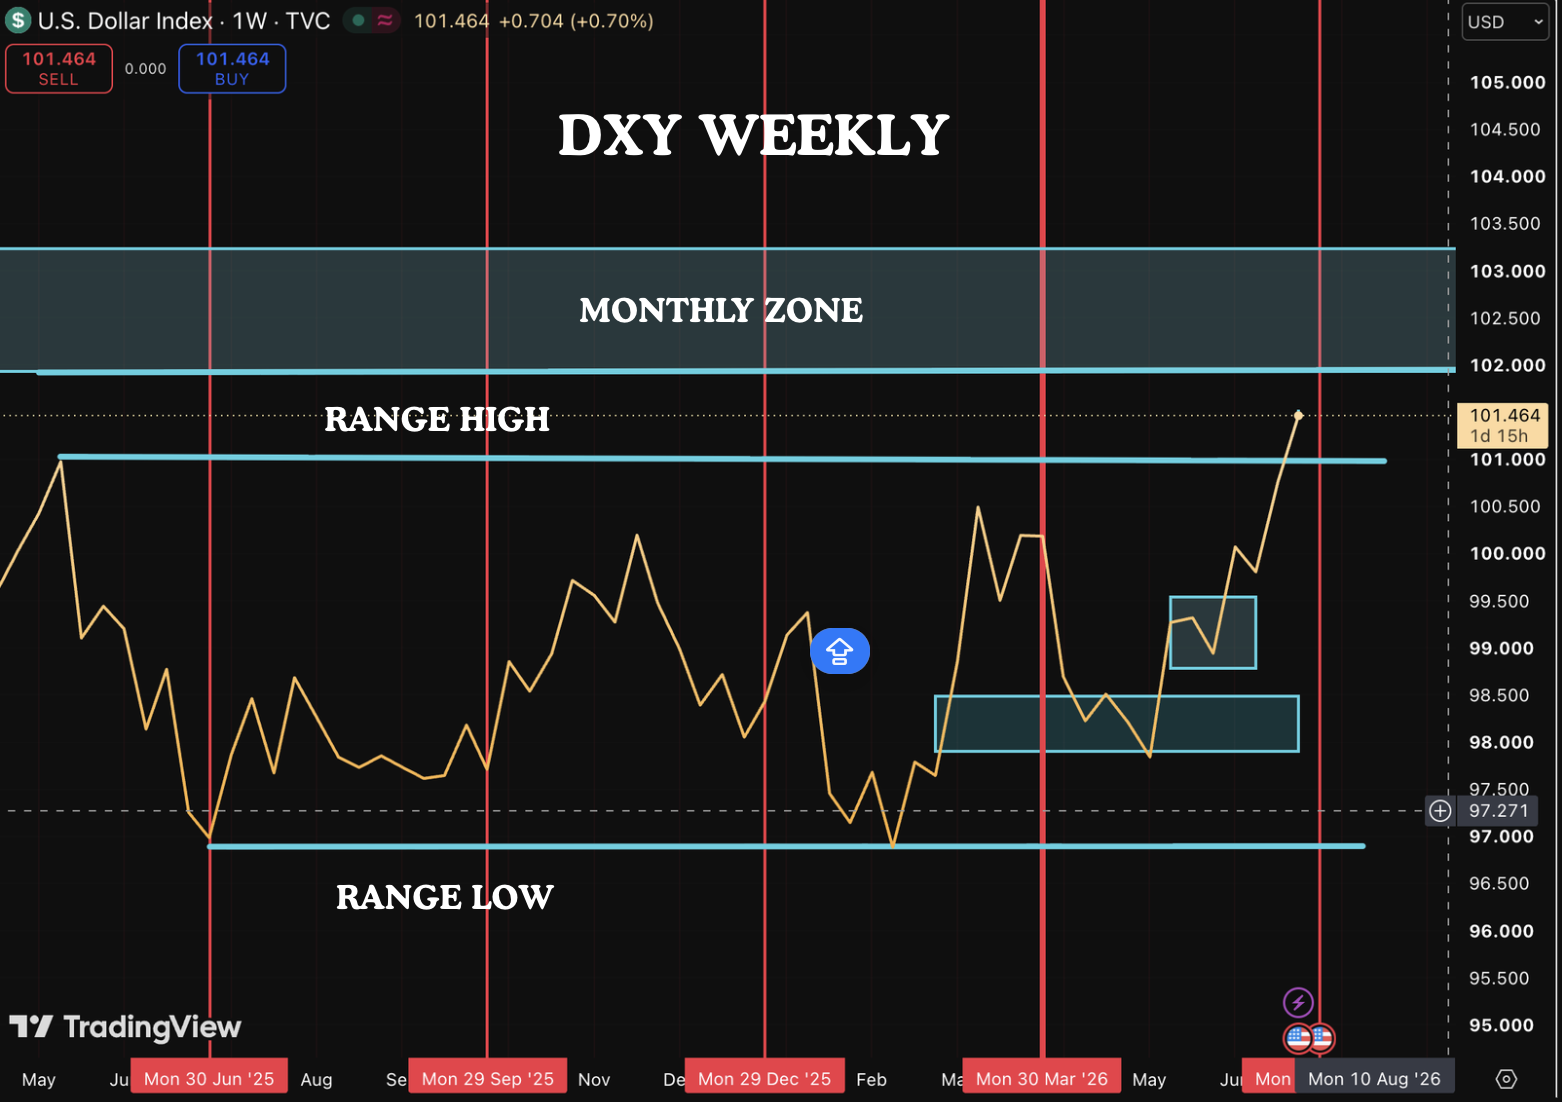
Here is the weekly chart of the DXY. Please see previous analysis. We have been looking for a top in the DXY. One of the reasons for this is fundamental . The the US administration strongly favours the weaker dollar. and they will do all attempts in their means to weaken the dollar. The second is the divergence between DXY and the 10 year yields. The 10 year yields have been falling while the DXY has been shooting higher. However we can have divergences for long periods of time. So until the price action confirms the divergence, the divergences are just divergences.
We also look at quarterly liquidity runs and when we have a quarterly liquidity run, we look for opposing side liquidity to be taken. So the setup is primed for dollar weakness. And at Muffett investments, we are waiting for the price action to confirm. This is confirmed by the purge. A sudden strong movement to take liquidity and then an equally strong move in the opposite direction. Here the Liquidity resides in the monthly zone which is an imbalance created 2 years ago. The price is poised to go into this zone either today following the core PCE or the next Quarter.
Once it goes there what happens next depends on whether we have a purge or not. IF there is no purge, price retraces but is supported by previous highs, then the DXY is primed to continue higher particularly if price can close above the monthly zone. That would be extremely bullish. If on the other hand, the price is rejected at this zone, we can expect price to take some form of liquidity below in the next quarter.

As the chart shows there is a clear divergence and we think that this will get resolved. So either the DXY falls or the 10 year yields will start to rise. We have to wait patiently to let the market show its hand. On the shorter timeframe, there is currently no evidence that the DXY has topped. So currently there are no trades in the forex market. However our interest in DXY analysis and the yIelds is our view on gold.
Since gold has inverse correlation with the 10 year yields and the dollar, we are waiting to see if gold can find a bottom.
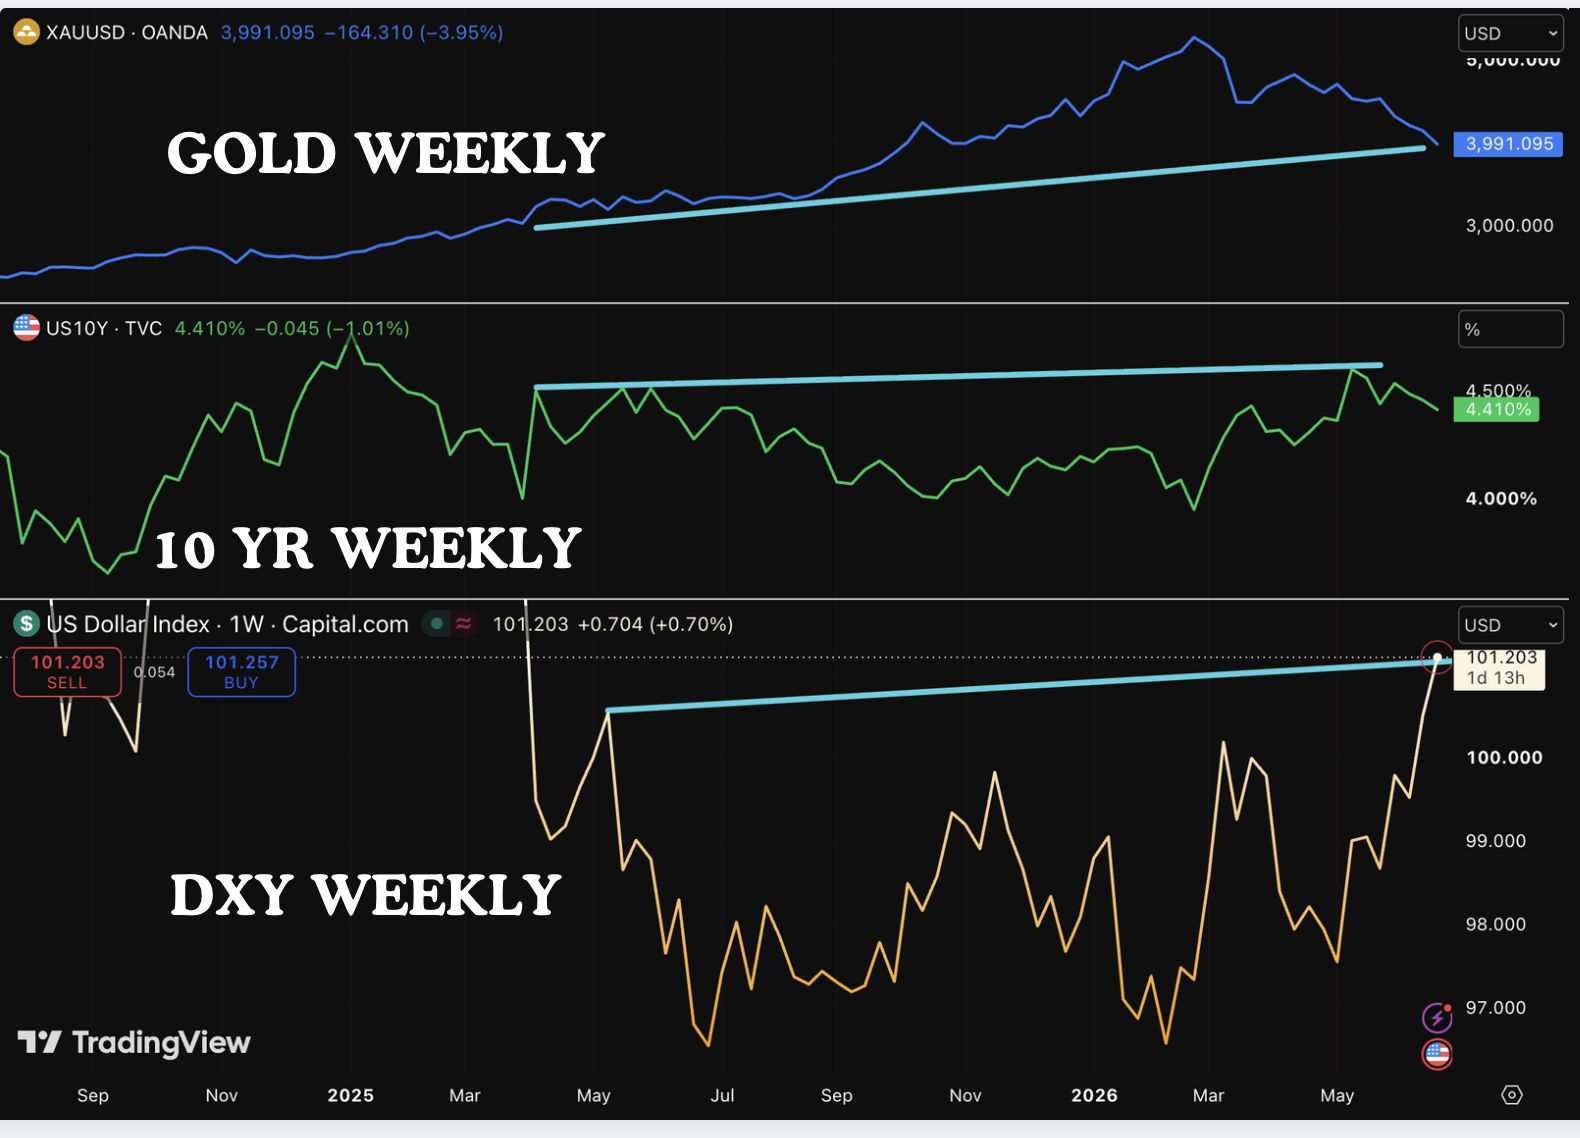
This chart compares DXY, gold and the 10 year yields. Both the DXy and the 10 year yields are showing higher highs but gold which is inverse to both of them is showing higher lows. In our view, we are very close to Gold bottom. Todays move up is not very convincing and we have not had a proper washout. This might happen next year which is the reason why we have not been very aggressive.
If price can go above $4355 on a closing basis, then gold has most likely formed a bottom. The current lows when we view the chart through the algorithmic lens. But fundamentally we are bullish. we are waiting for price to confirm the bottom.
May the Lord God Bless you and Walk with you.
Analysis done in good faith and not investment advice.